Estimated annual cost increase for road and rail infrastructure in the EU and UK at 2 °C
(Mulholland & Feyen, 2021)

The role of impervious surfaces
Cities are made up of impervious materials: asphalt, concrete, pavements, buildings, which absorb solar energy during the day. Unlike vegetated and unsealed surfaces, they store heat instead of dissipating it, releasing it slowly at night. This keeps urban areas warmer for longer, putting stress on infrastructure as well as people.
A Sentinel-2 true-colour satellite image of Hannover illustrates this urban environment, while the Copernicus Land Monitoring Service (CLMS) Imperviousness Density layer highlights the extent to which the land surface is sealed.
Source:
CLMS High Resolution Imperviousness


(Hannover)
The role of buildings
Buildings play a double role: on one hand they are constructed from impervious materials that absorb and store heat, and on the other their height influences how heat is trapped and released within the urban environment.
Tall buildings can provide limited shade during the day, locally lowering surface temperature, but these dense, high-rise urban forms block wind and restrict air circulation, reducing the city’s ability to cool. At night, heat becomes trapped within urban canyons, preventing roads, rails, and public spaces from fully cooling down.
Source:
CLMS Urban Atlas Building Heights


(Hannover)

Information on building height and urban structure
can be derived from the Copernicus Land Monitoring Service Urban Atlas building height dataset, which provides estimates of building height classes across European cities at building level.
Envato
Nearly half of the roughly 10 000 cities in the world have faced increased heat exposure over the last 4 decades.
Seeing heat from space – Sentinel-3
Infrastructure managers traditionally rely on engineering standards, periodic inspections, weather forecasts and limited in-situ measurements to assess how heat affects transport networks, energy systems and urban assets.
While these approaches provide essential operational guidance, they offer only fragmented and localised insights into how surface temperatures vary across entire cities.
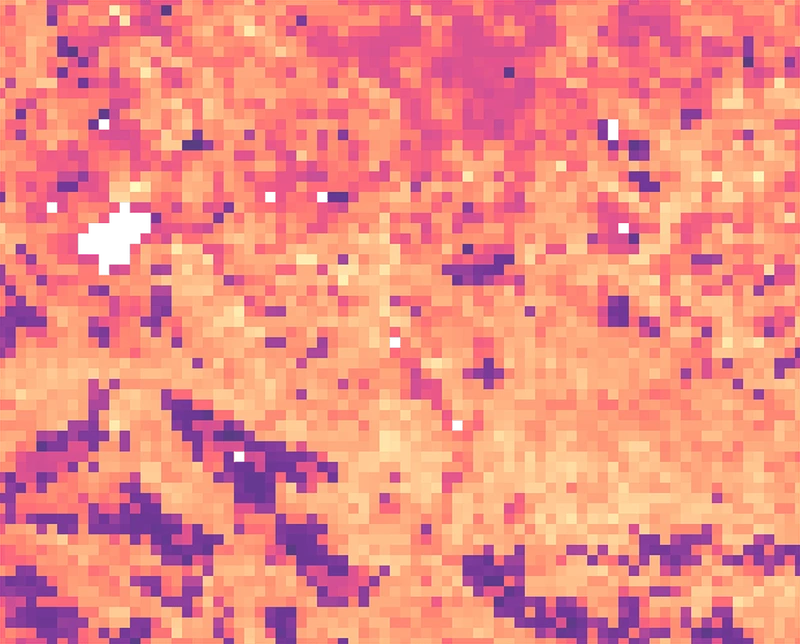
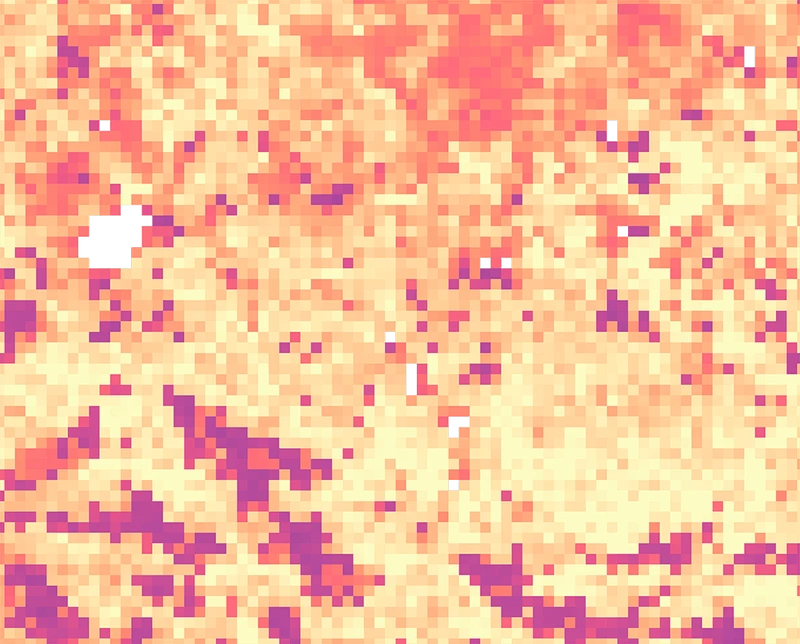
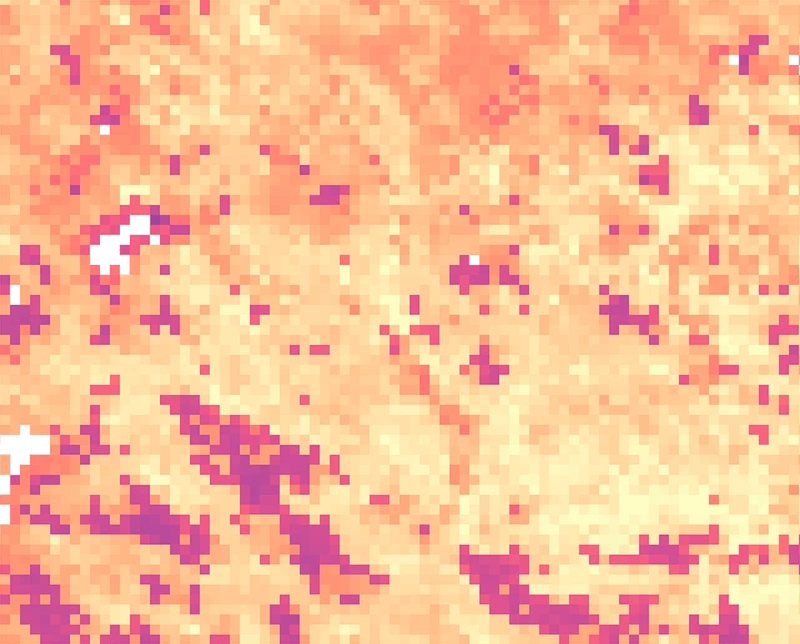
Land Surface Temperature (LST) maps show how hot the Earth’s surface becomes.

(Hannover)
(Hannover)
(Hannover)
(Hannover)
(Hannover)
(Hannover)

They are derived from thermal infrared measurements captured by Sentinel-3 and similar satellites, which record the heat radiation naturally emitted by urban surfaces.
These observations are converted into temperature values across entire cities, revealing how heat is distributed at the surface.
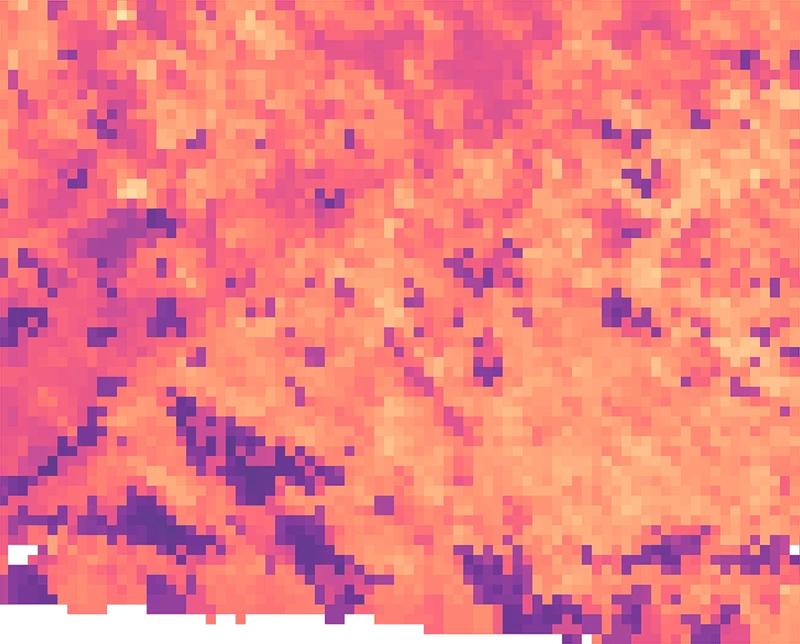
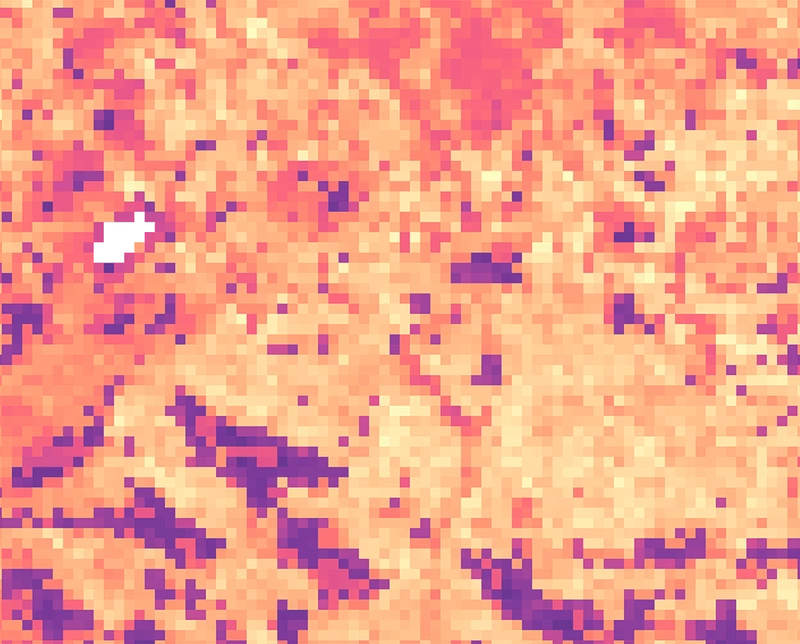
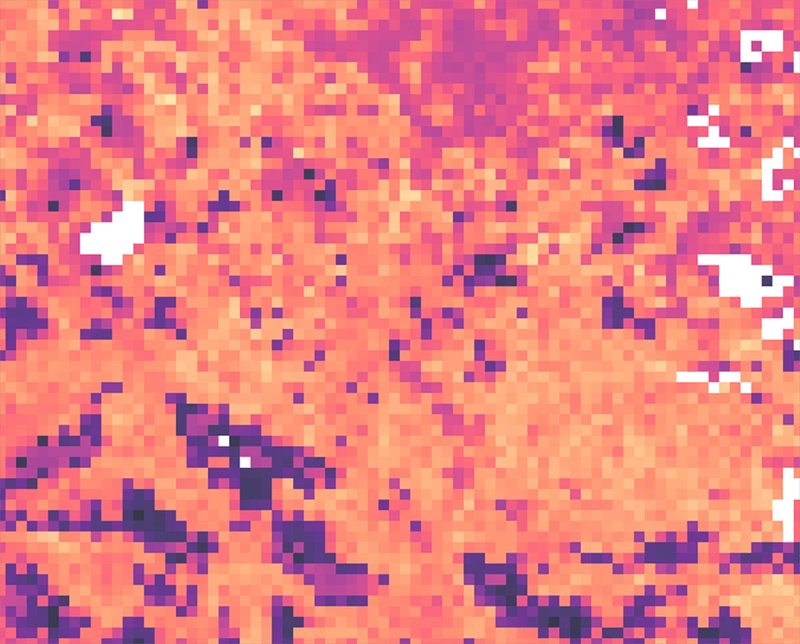
Sentinel-3 measures Land Surface Temperature across the globe near daily at 1000 m spatial resolution, providing a temporal perspective on how surface heat conditions evolve.
As the seasons progress, heat hotspots emerge, intensify, and typically peak in early to mid-summer.
Viewed as a sequence of images, these observations reveal how urban heat develops and recedes over time.
Timeseries of daytime (acquisition approx. 10:30) LST derived from Sentinel-3 for downtown Hannover

Envato
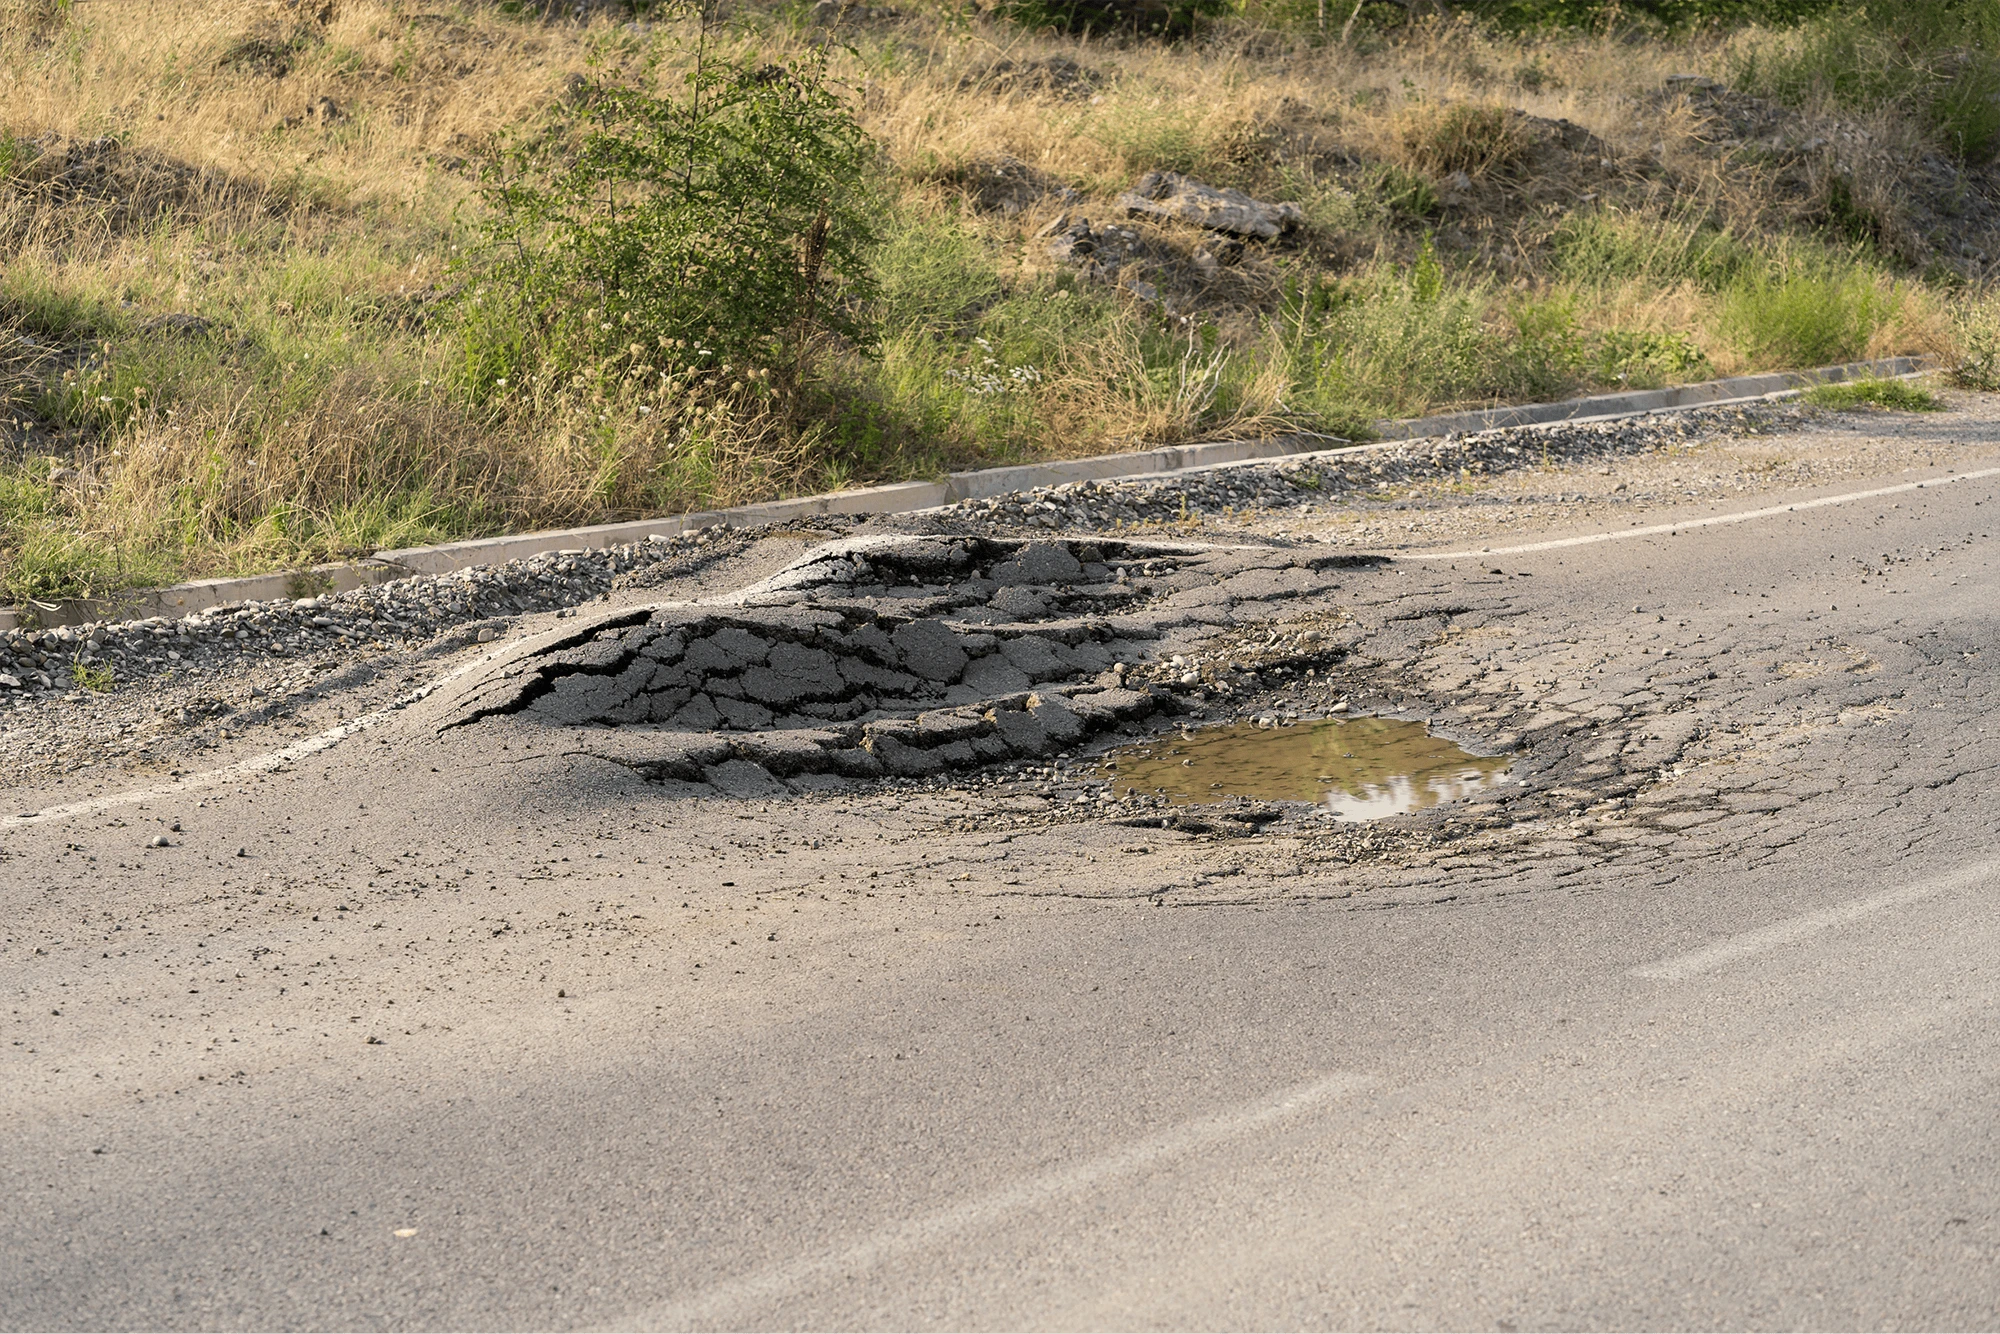
Heatwaves cause rails to expand and sometimes buckle, catenary wires to sag, rail side equipment to fail more often.
From regional patterns to street-level detail: Downscaling techniques
Sentinel-3 provides frequent, city-scale thermal patterns, but infrastructure decisions need finer spatial detail.
Downscaling methods help translate coarse thermal observations into sharper maps by combining the coarse, Sentinel-3 LST with higher resolution information, such as land cover, vegetation, built-up density, and more.
While these methods can help provide important insights, it is important to note they do not create new measurements at a higher resolution, but instead rely on statistical or physical relationships to infer likely patterns within a coarse pixel. Thus, these products should be interpreted as informed estimates rather than direct observations.


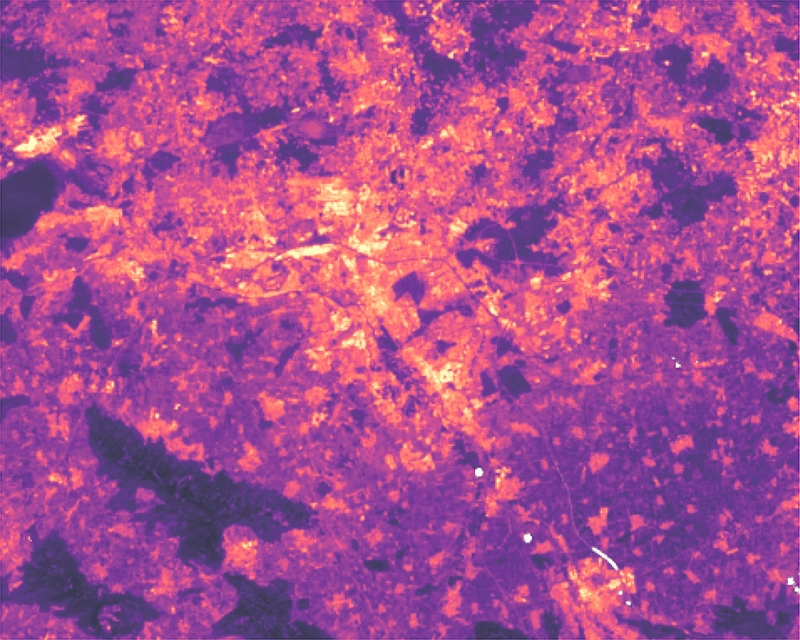
From regional patterns to street-level detail: High resolution missions
Copernicus Contributing Missions, like Landsat, complement Sentinel-3 by providing land surface temperature at 100 m native resolution, provided resampled at 30-metre resolution, though not as frequently (approx. once every 2 weeks).
These LST images might not capture the maximum LST during the day, but still reveal detailed temperature patterns across streets, industrial zones, transport corridors, and built-up areas, vital information for identifying thermally vulnerable infrastructure and prioritising maintenance and adaptation measures.
When interpreted together, coarse-resolution frequent observations and less frequent high-resolution imagery support a more comprehensive understanding of where heat stress related degradation to infrastructure is likely to occur.
Even better news with future the upcoming Sentinel expansion mission LSTM, set to join the Copernicus in 2028. It will provide LST at 50 m resolution every 2 days, supporting systematic monitoring of heat exposure across infrastructure assets.
(Hannover)
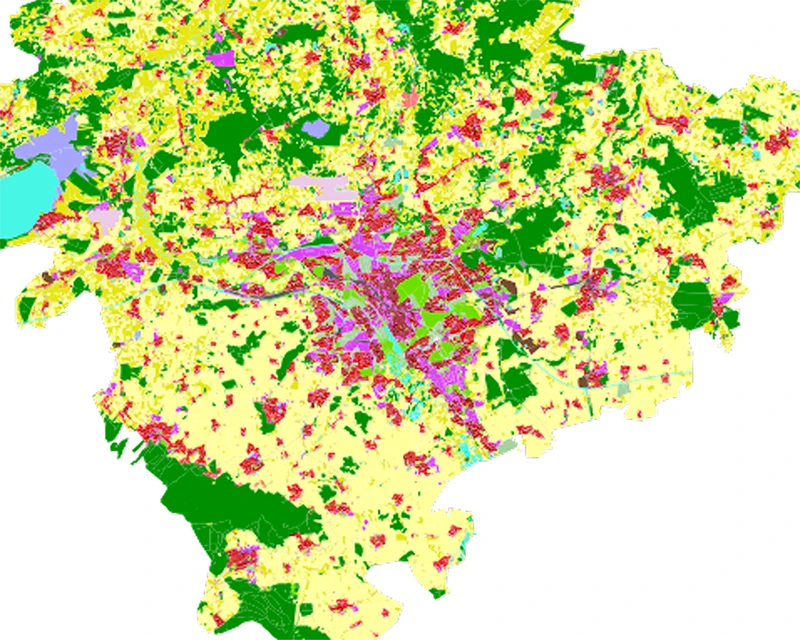
Urban Land use
To understand why Land Surface Temperature hotspots appear where they do, LST can be combined with an urban land use and land cover dataset which describes what our cites is made of. Products such as the Copernicus Land Monitoring Service Urban Atlas classify neighborhoods into residential areas, industrial and commercial zones, roads, and green spaces, delivered as consistent data sets across European cities.
Urban Atlas is derived from satellite imagery, including Copernicus Sentinel 2, and validated using expert interpretation and field validation.
(Hannover)
From maps to prioritisation
Linking these Land Use classes with Landsat LST helps identify which urban functions and materials retain the most heat, enabling targeted planning and allowing cities to benchmark patterns over time and between locations.
For example, we can see areas near Hannover Hauptbanhof (which according to Urban Atlas are categorized mainly as industrial and railway) have higher temperatures compared to residential areas with plenty of vegetation.


(Hannover)
During extreme heat events,
these insights support real-time operational decisions, such as temporarily reducing loads, adjusting service schedules, or suspending operations to prevent damage to infrastructure.
They also enable targeted heat mitigation actions, including water-based cooling of surfaces, temporary shading of critical assets, application of cool or reflective materials to reduce surface temperatures in the long term.
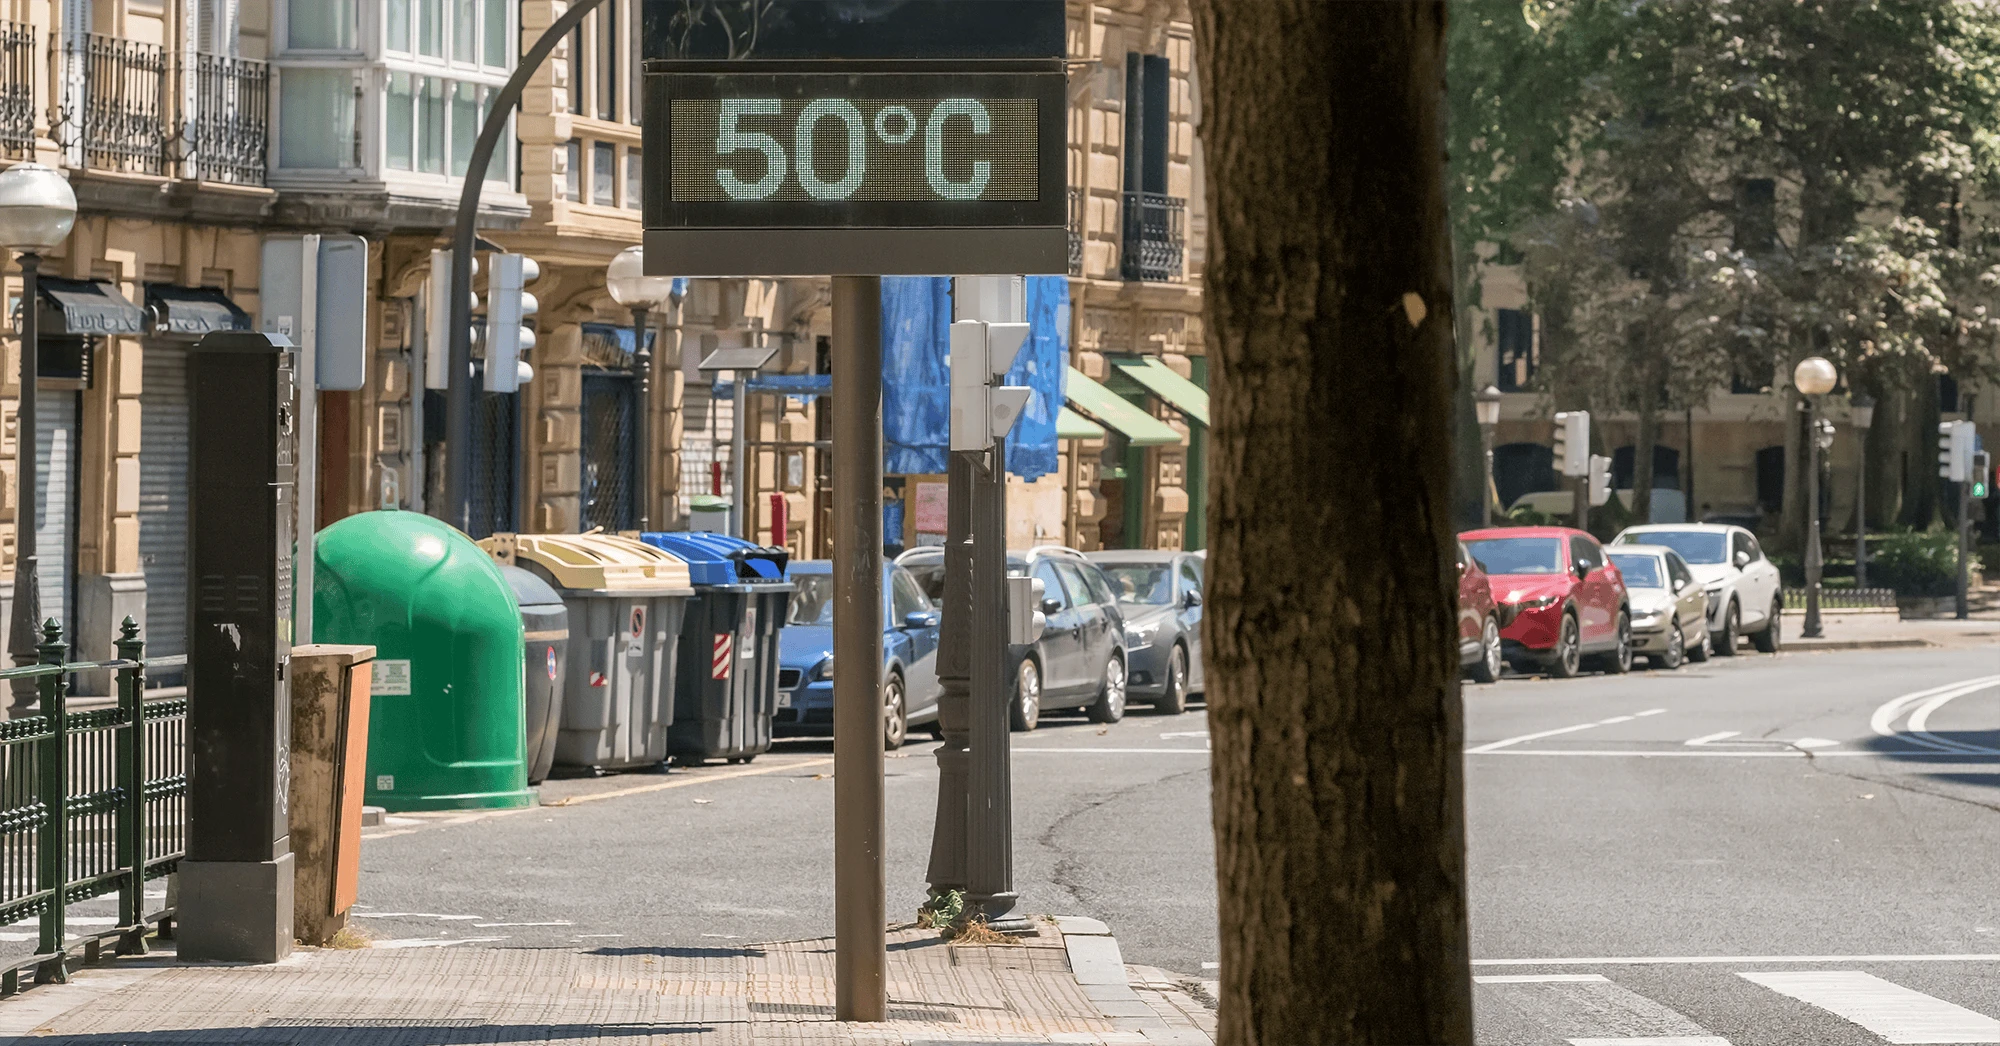
Shutterstock
Street thermometer in Bilbao city displays terrifying 50 degrees Celsius during intense summer heatwave
Who benefits
from Copernicus?
Climate projection data from the Copernicus Climate Change Service (C3S) indicate that Europe is projected to experience an increasing number of heatwave days in the coming decades -periods when temperatures remain unusually high for several consecutive day, making the monitoring of infrastructure exposure to extreme heat essential for risk reduction and long-term resilience.
Without Copernicus, city engineers, road authorities, and utility operators rely on sparse ground sensors, historical averages, and reactive inspections, often identifying heat stress only after damage has occurred. With Copernicus, satellite-derived downscaled land surface temperature (LST) enables urban planners, infrastructure managers, and civil protection agencies to detect where and when infrastructure is exposed to extreme heat across the entire network.
Urban heat adaptation measures are often based on general guidelines or coarse climate data, limiting their effectiveness. High-resolution thermal data allows urban planners, local governments, and climate adaptation teams to identify street-level heat patterns and vulnerable neighborhoods, supporting targeted interventions and enabling them to monitor the effectiveness of implemented measures over time.
Material choices and design decisions are typically guided by standards that may not reflect local heat conditions or future extremes. Copernicus observations support civil engineers, construction companies, and infrastructure designers in selecting climate-resilient materials and adapting design practices to evolving thermal conditions.
Copernicus can help transform heat from an invisible, reactive risk into a measurable, actionable variable for infrastructure planning and management.
Projected heat wave days in Europe
Future climate projections show that heatwave days are expected to increase across Europe under all emission scenarios. The two lines represent different possible futures depending on global greenhouse-gas emissions. Even in a moderate pathway, extreme heat exposure is projected to rise, reinforcing the need for climate-resilient infrastructure planning.
Climate Assessments and adaptation strategy
The EU Climate Adaptation Strategy calls for improved climate risk assessments and evidence-based adaptation planning across European cities. High-resolution thermal maps support this by identifying persistent urban heat hotspots and vulnerable areas. Several European cities have integrated satellite-derived temperature data into urban climate studies and adaptation strategies.

Explore this
further with us
Copernicus offers free and open Earth Observation data.
Long term continuity commitment enables other industries build bespoke workflows and services for their operational needs.
EUSPA can help interested stakeholders explore which Copernicus datasets and indicators are most relevant for their operational needs, how they can be turned into dashboards, alerts or reporting tools together with EO service providers.