Biodiversity monitoring nearby mining operations
- Raw materials
A Mine Environmental Manager regularly needs to answer a set of key questions. Is the mine footprint getting closer to sensitive habitats? Are rehabilitation areas recovering? Where should field teams focus next?
The answers to these questions shape permits, site plans, and reports. They also build trust with regulators, communities, and investors.
Over
-
% of EU land
is already protected
and this is becoming a defining constraint for mining projects. As the protected share moves towards 30% by 2030, new projects must fit into an increasingly dense and complex conservation network.
Mining and biodiversity:
a lifecycle impact across europe
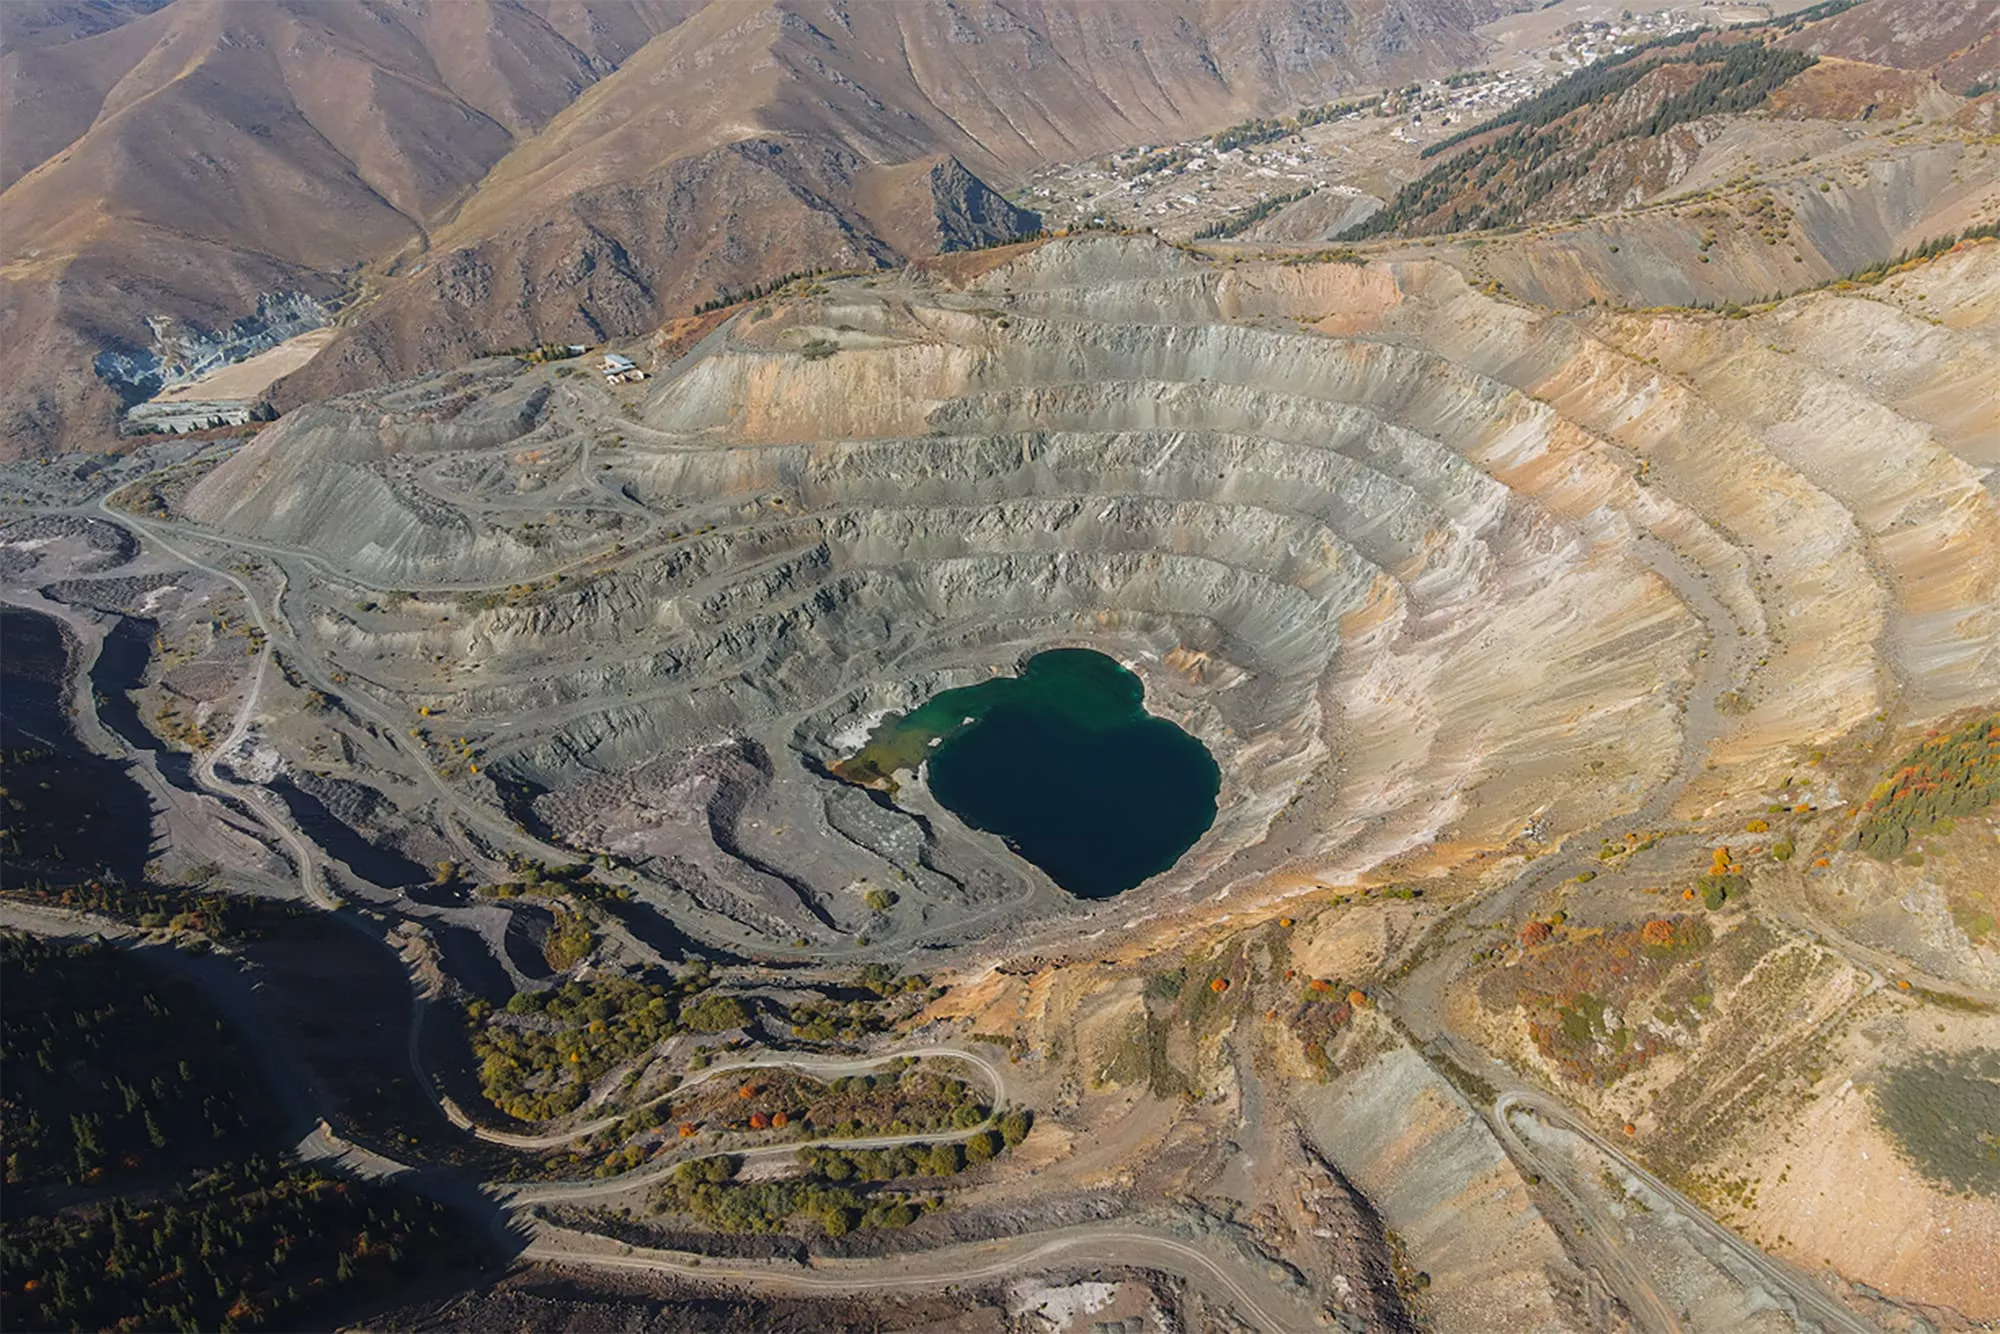
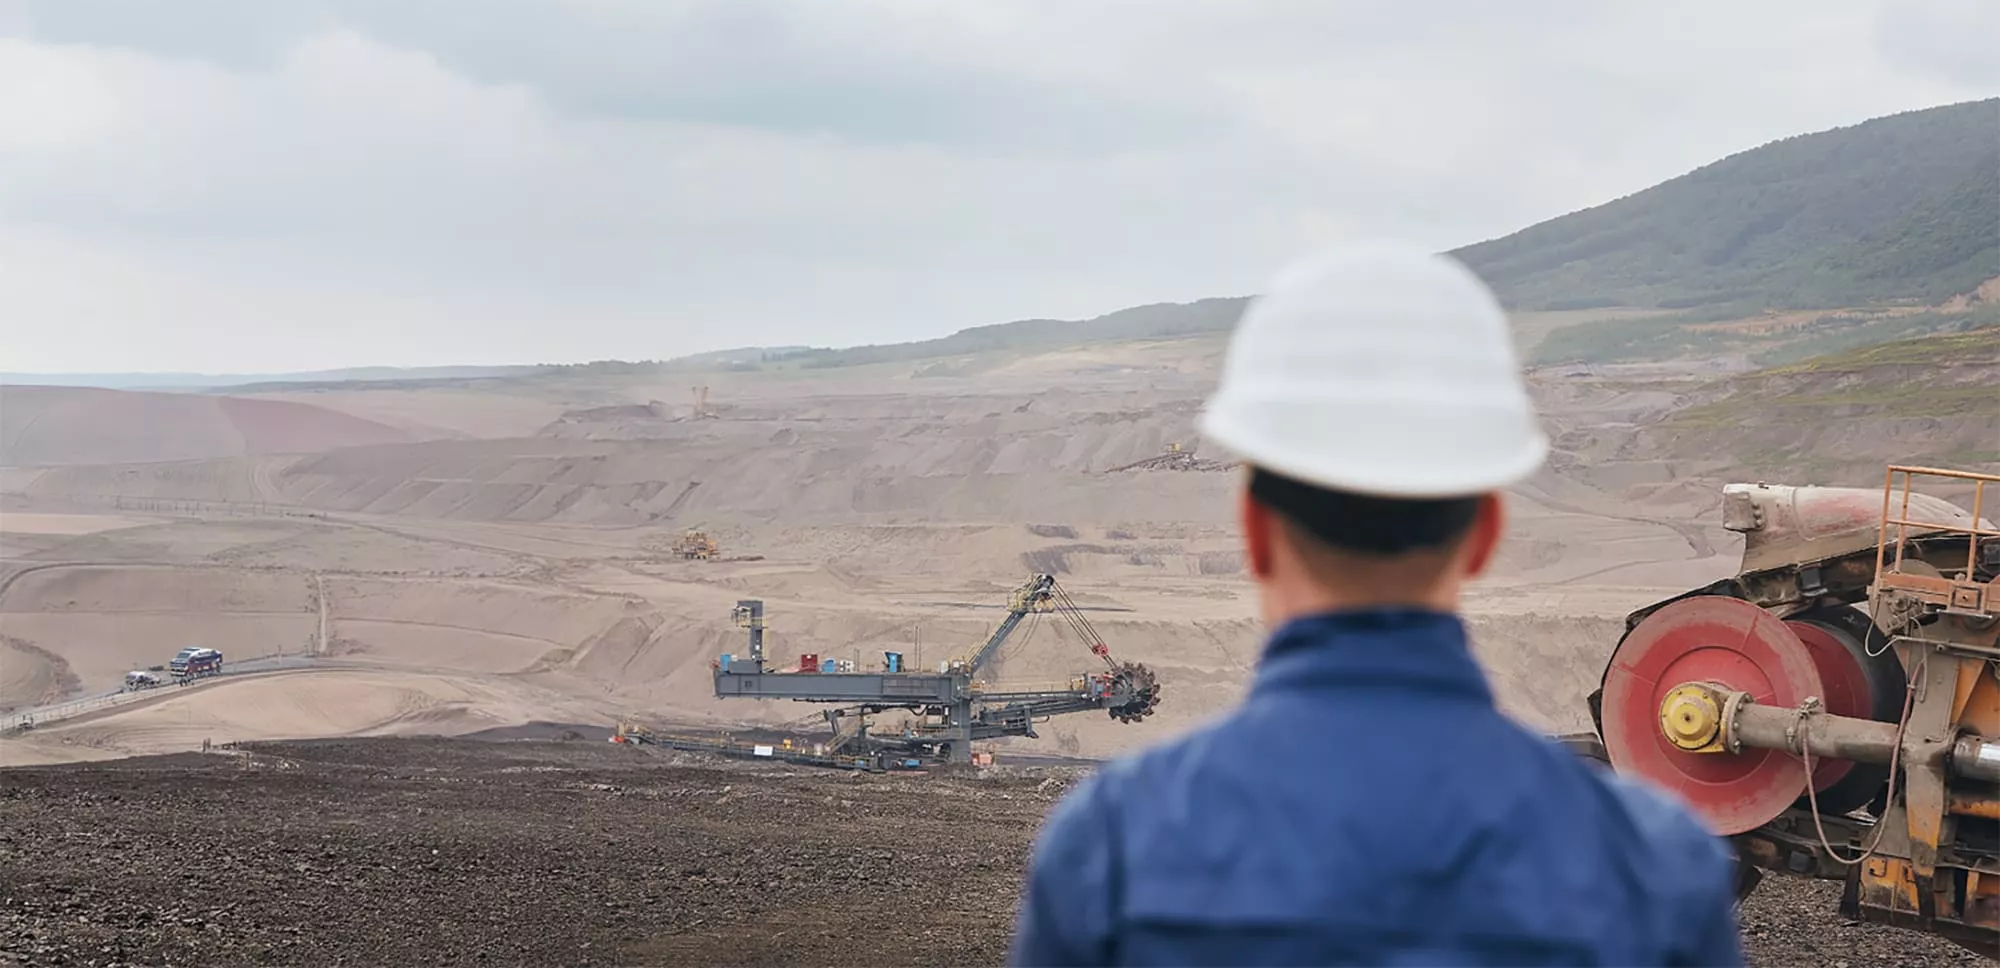
Mining affects biodiversity at every stage. Site preparation and access roads clear vegetation. Active extraction and waste management reshape the land. Water infrastructure alters local hydrology. Even rehabilitation and closure leave a lasting mark on habitats and ecological connectivity.
This matters across Europe, where many exploitation fields are intertwined with natural areas under conservation measures. [Mina Doade - Spain, Sakatti - Finland, Barroso - Portugal] The pressure is set to grow. Just over 1 in 4 hectares of EU land is already under protection, and the EU is targeting 1 in 3 by 2030.
Fitting mining projects into this expanding conservation network is becoming harder.
Why this matters
For mining professionals, proximity to sensitive habitats is not only an environmental issue, but also a compliance, operational, and reputational one. Mine Environmental Managers must ensure permit conditions are met, back biodiversity commitments with evidence, and identify potential impacts early — before they escalate.
Biodiversity information is typically collected through periodic ecological surveys, with habitat maps manually updated to reflect new findings.
These remain essential for species-level evidence, but they are slow and costly: investigations depend on specialist external expertise, narrow seasonal windows, formal reporting. They are hard to scale across large areas and multiple years.
Reducing unnecessary fieldwork and speeding up input collection can save significant effort and accelerate operational decisions.
European examples
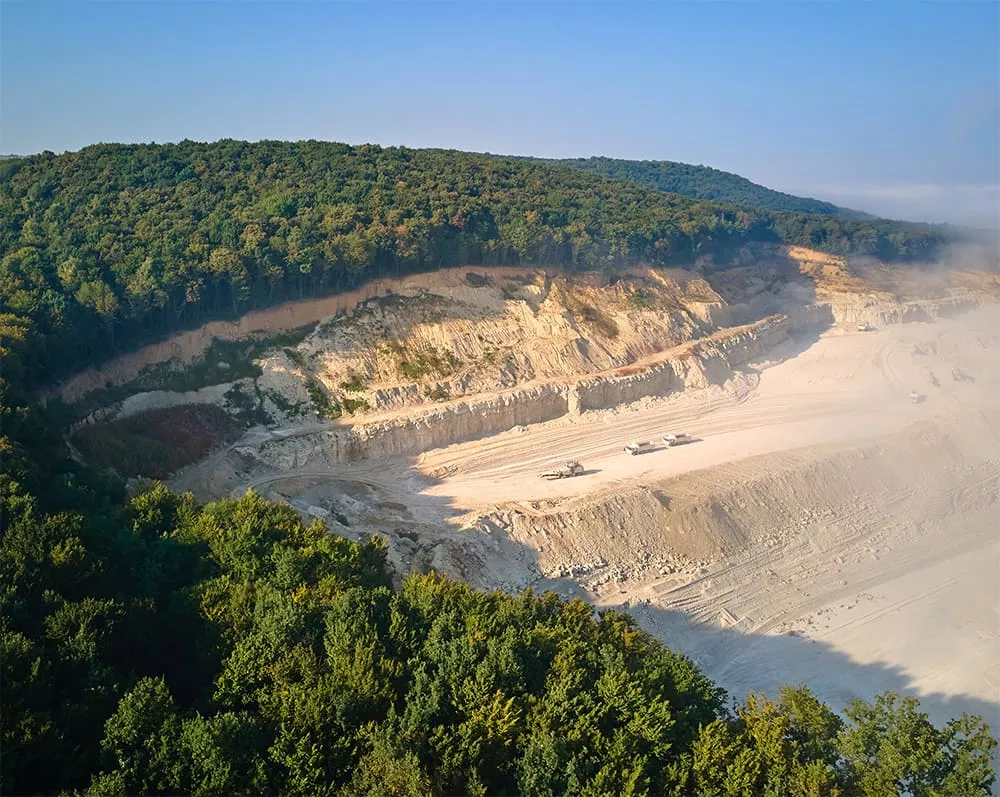
Real cases show how biodiversity constraints shape mine planning across Europe, as more than half of the EU's "strategic" mineral projects sit on, or within a kilometre of sites in the Natura 2000 network.

At Keliber's lithium project in Finland, a Natura 2000 area sits approximately 300 m from a mine boundary — and tailings pond design was adjusted to protect Siberian flying squirrel habitat. (Keliber, Finland) - source
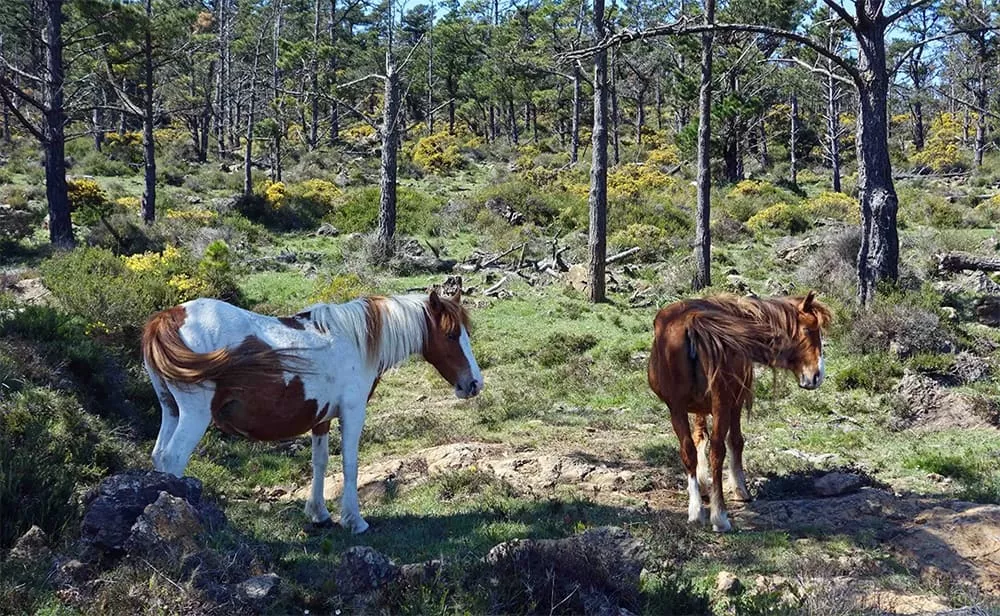
Spain's Mina Doade lithium project lies within 1 km of a Natura 2000 site, and is one of the many EU strategic mineral projects bordering protected land.
After an earlier open pit project was rejected on environmental grounds in 2020, the mine was redesigned as an underground operation to reduce surface impact in the protected Galician landscape. (Mina Doade, Spain ) - source
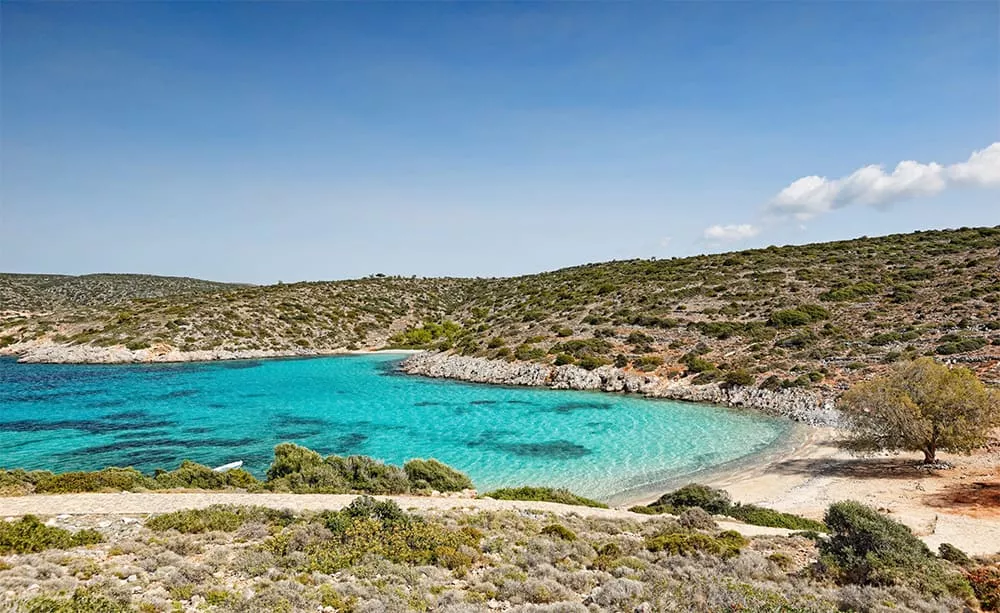
On Chios island, an antimony project, aimed at a strategic metal for defence and renewables, overlaps a Natura 2000 site. The project is planned as a mix of surface and underground operations, with strong environmental commitments built into the tender conditions.
(Chios, Greece) - source
Introducing EO
This is where Copernicus, the EU's Earth observation programme, can help.
Copernicus does not replace ecologists in the field. It acts as a free, first-level screening layer that helps the Environmental Manager focus effort where it matters most:
- Early disturbance detection: detects visible changes in habitat conditions by flagging where land-cover or vegetation patterns have shifted most, helping identify emerging pressure on habitats before it escalates.
- Field-team prioritisation: narrows attention to the locations that need targeted ground checks, reducing unnecessary fieldwork and supporting faster decisions on where in-situ investigations are most needed.
- Repeatable, large-area coverage: enables consistent monitoring of mine sites and surrounding habitats over time, supporting comparison across seasons, years and operational phases.
The value is not a "species count from space." It is knowing where to send specialists on the ground.
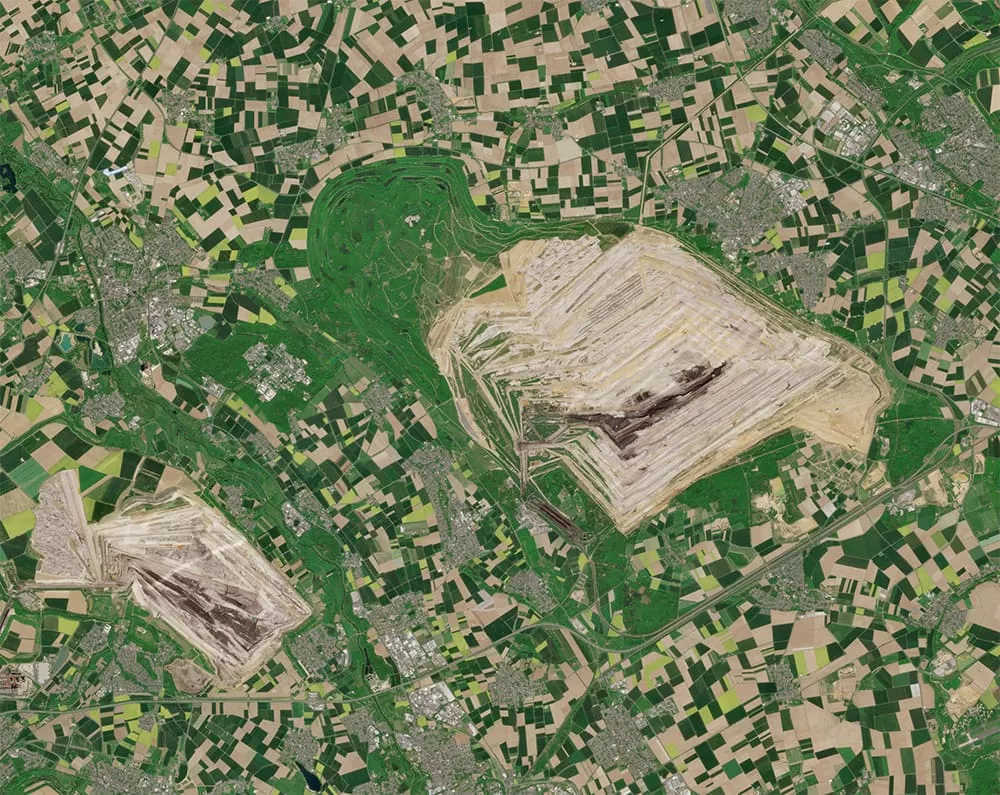
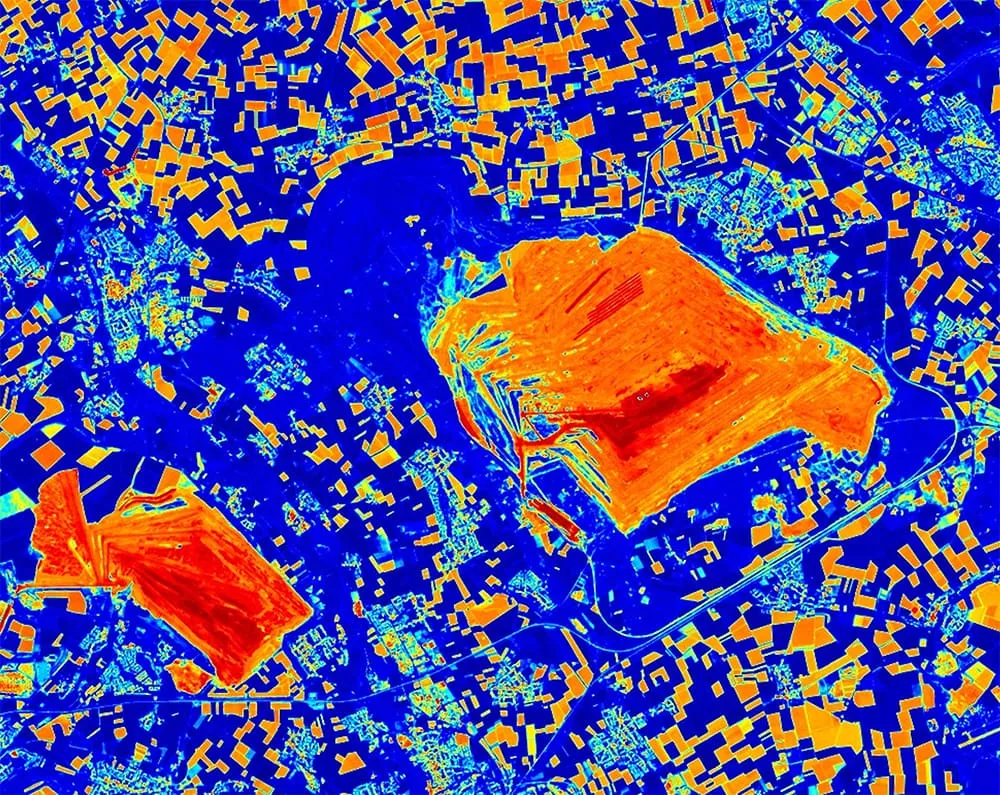
Moisture index derived from Sentinel-2 data shows significantly reduced soil moisture across the mine area. Large-scale mining operations can impact local water cycle dynamics, lower the ground water levels and reduce soil moisture in surrounding natural areas.
Hambach mine (Germany), 1 May 2026.
Habitat mapping and footprint
Copernicus can support habitat mapping and footprint analysis around mining sites by providing a consistent view of land cover, vegetation patterns and habitat types. Sentinel-2 imagery can be used to screen how these conditions change over time, helping identify areas where vegetation loss, land-cover change or habitat disturbance may be emerging.
Several vegetation indices can be derived from Sentinel-2 imagery to track these changes consistently over time:
- Vegetation greenness: useful for tracking general vegetation gain or loss over time (NDVI – Normalised Difference Vegetation Index).
- Vegetation water content: useful for detecting vegetation stress before it becomes visible as a loss of greenness (NDMI – Normalised Difference Moisture Index).
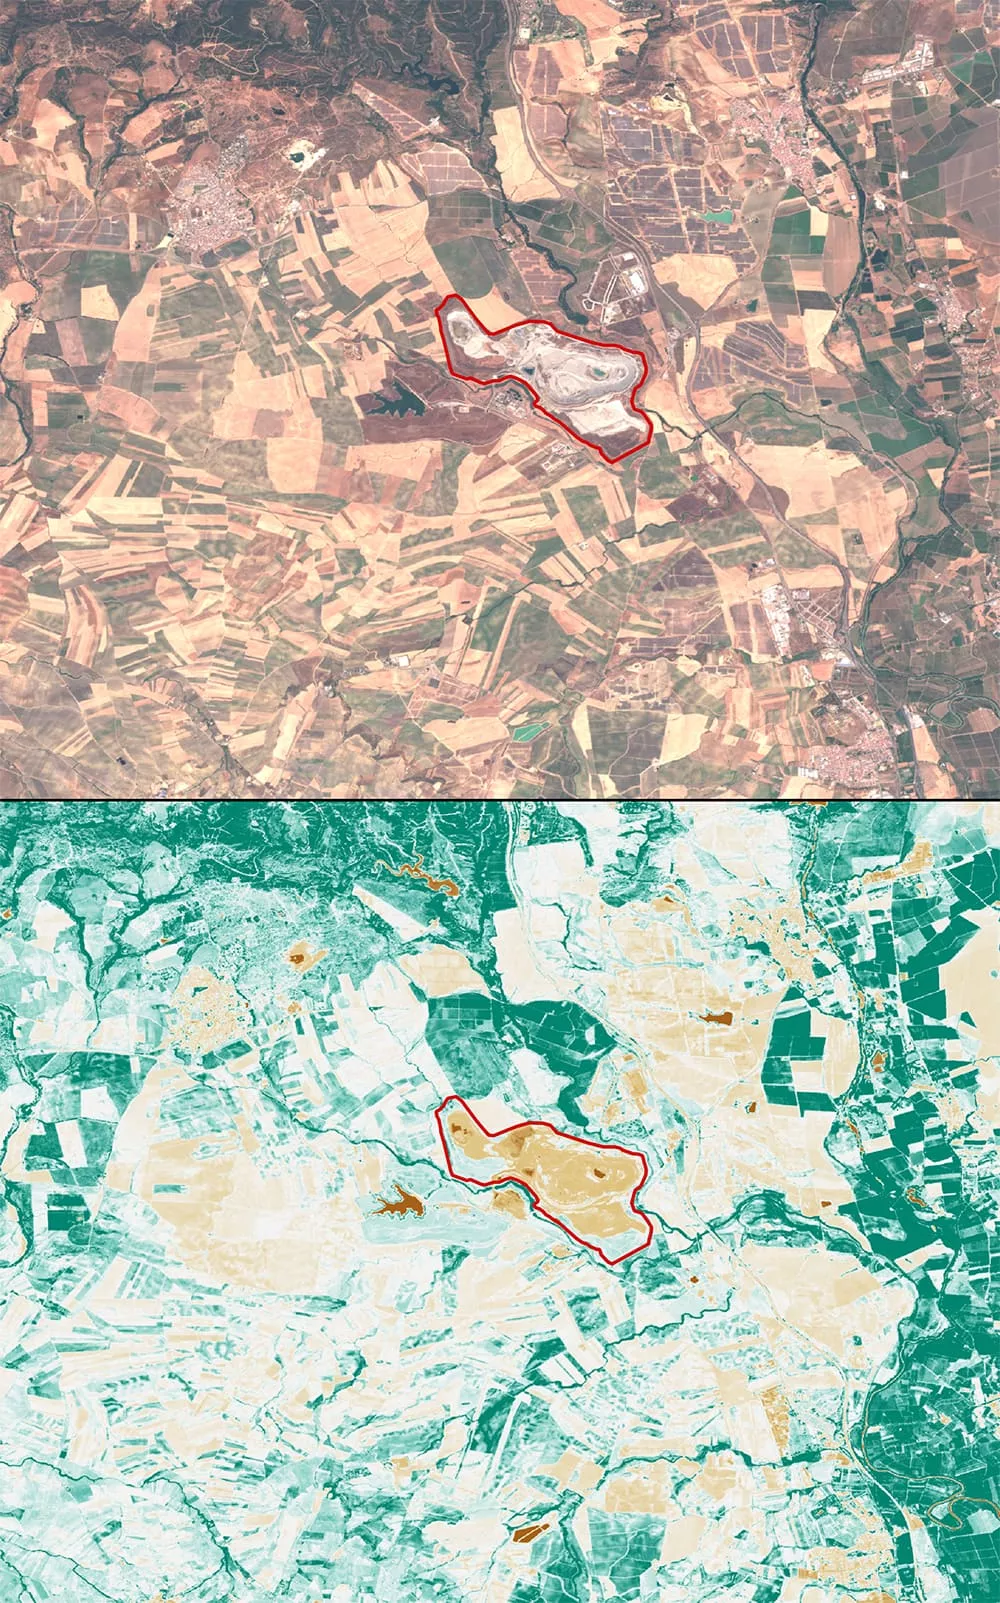
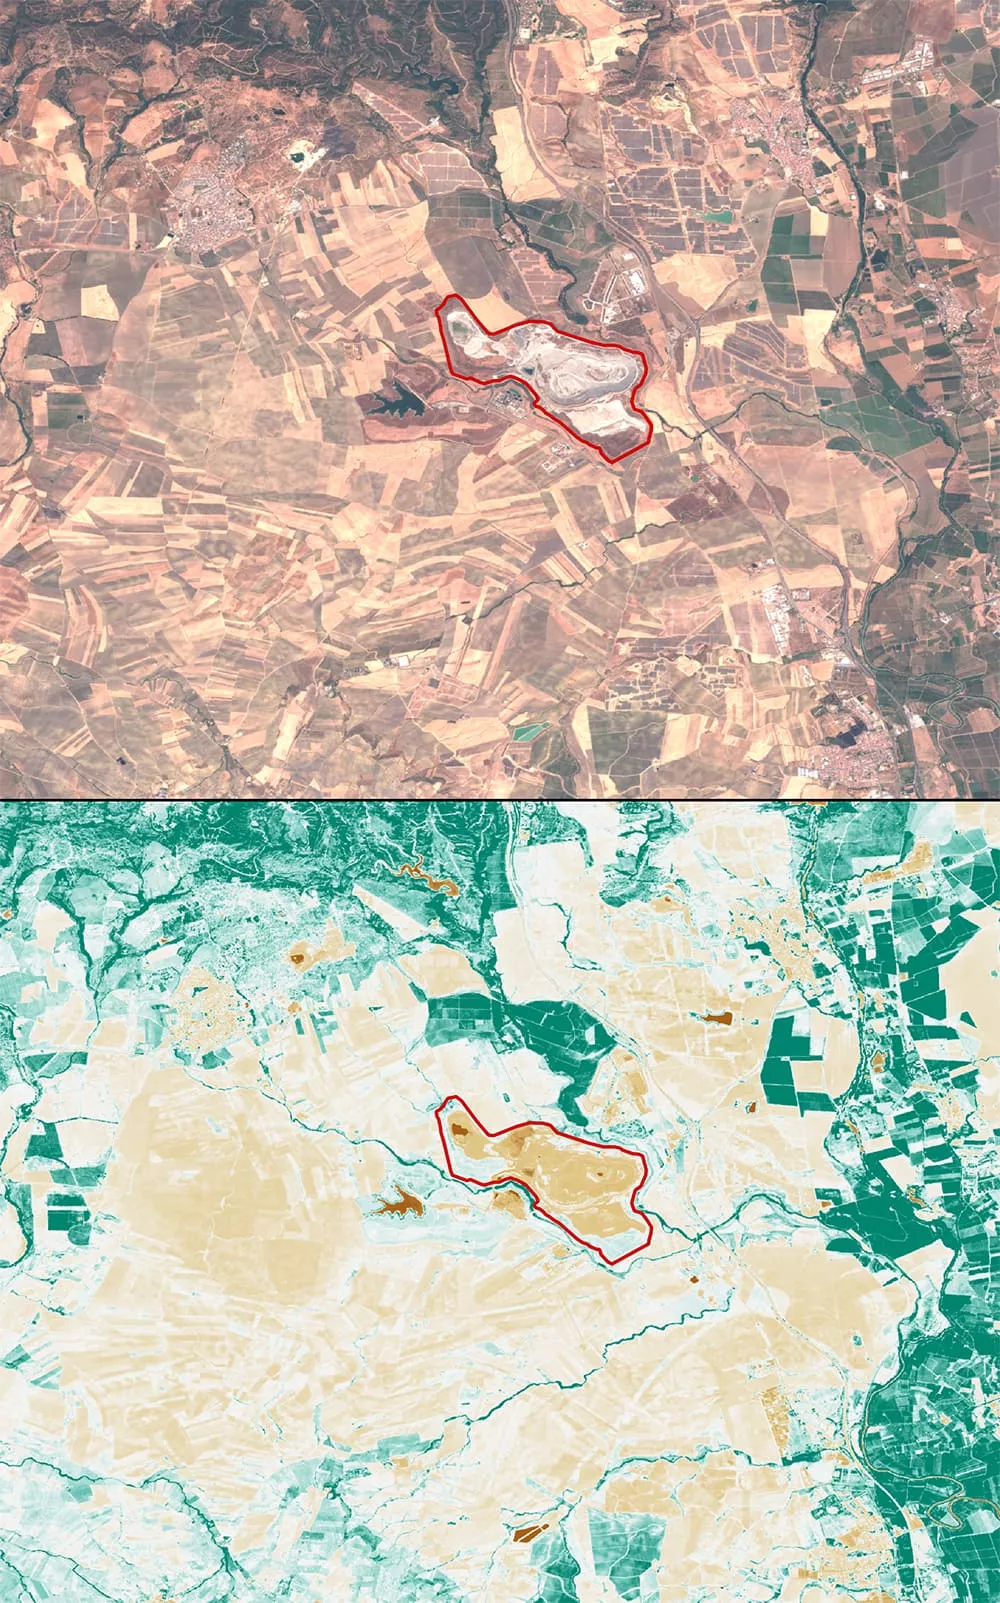
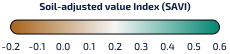
- Vegetation cover: useful where bare soil may influence the signal, such as in sparsely vegetated or disturbed mine areas (SAVI – Soil-Adjusted Vegetation Index).
- Bare ground exposure: useful for flagging abrupt clearance or land-cover change (NBR – Normalised Burn Ratio).
Used together, these indices help the Environmental Manager see whether a formerly vegetated area near the mine is becoming more disturbed, whether rehabilitation areas are greening consistently, or whether a new stockpile, road or working area is affecting adjacent habitat. That immediately tells the manager where a targeted ecological check may be most useful.
Beyond vegetation indices, Copernicus also provides ready-to-use land-cover maps that show where areas are covered by vegetation, trees, grassland, built-up surfaces or bare ground. These maps can help distinguish areas that are still affected by mining activity from areas that appear more stable, recovering or rehabilitated.
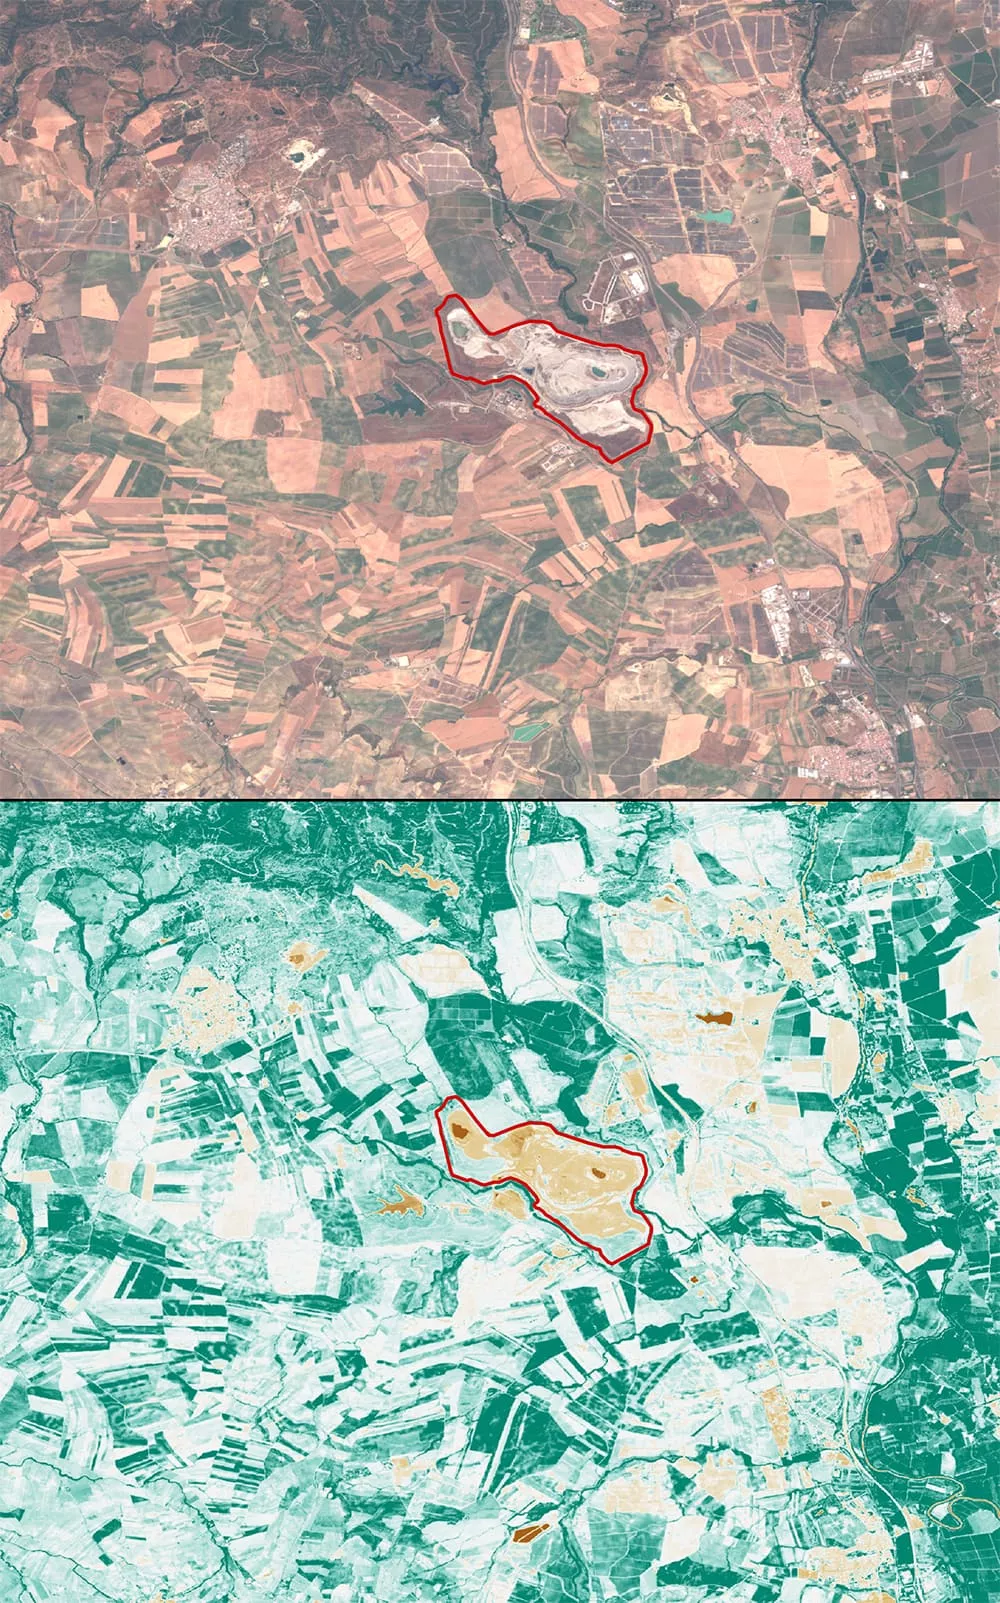
Mina Cobre Las Cruces
The time series shows seasonal vegetation dynamics in the vicinity of an open-pit mine where environmental restoration is underway.
Continuous monitoring with Copernicus data makes it possible to distinguish mining-related disturbance from natural seasonal change, placing site-level observations in their broader environmental context.
Connectivity and protected-area screening
Mine infrastructure is dynamic in essence. Operational road networks, waste areas and working zones change constantly, and each change can shift the boundary between operational land and the habitats around it. Impact on biodiversity does not stop at the mine fence. Effects like dust, disturbance or a shrinking buffer can reach sensitive habitats at a distance.
A waste-area expansion may stay outside a protected boundary but still impact ecosystems and natural areas between sensitive habitats. This weakens connectivity, meaning the ability of habitats to link up so species and ecological functions can continue, and it can matter even before there is any direct overlap. The Environmental Manager needs to know not just what happens inside the footprint, but how close activity is getting to sensitive zones and how that proximity is changing.
In this context, Copernicus data can support the automated detection of exposed bare ground across open-pit mines, waste areas and surrounding disturbed zones. By tracking where bare surfaces expand, contract or become progressively re-vegetated, it becomes easier to understand whether mining activity is moving closer to sensitive areas or whether rehabilitation measures are starting to take effect. This adds a practical layer to connectivity screening, helping distinguish newly disturbed areas from zones that appear stable or recovering.
The Copernicus Land Monitoring Service (CLMS) helps answer this. Its Natura 2000 (N2K) product maps protected areas in detail and shows how close mine activities are to sensitive zones and how that distance changes over time. This gives the Environmental Manager earlier visibility, leaving more time to adapt site planning, discuss mitigation and avoid unexpected outcomes in later stage permitting or reporting.
Condition and recovery over time
A single ecological visit can show what the site looks like on one date. A time series view can show whether recovery is actually happening. For the Environmental Manager, that difference is important, because biodiversity commitments are often not only about avoiding damage during operations but also about demonstrating that restoration and rehabilitation are working as the mine progresses.
Copernicus time series can help distinguish short-term greening from more sustained recovery. As areas are progressively rehabilitated (a worked-out section, waste area or haul road reshaped and revegetated), a rehabilitation area may look green in one season, but EO can show whether that greening is consistent over time or fades again after a dry period or operational disturbance.
Sentinel-2 vegetation health indicators (e.g., NDVI and SAVI) are useful here because they allow repeated observation of vegetation condition over the same areas across time. This monitoring also continues after mine closure, demonstrating long-term recovery processes
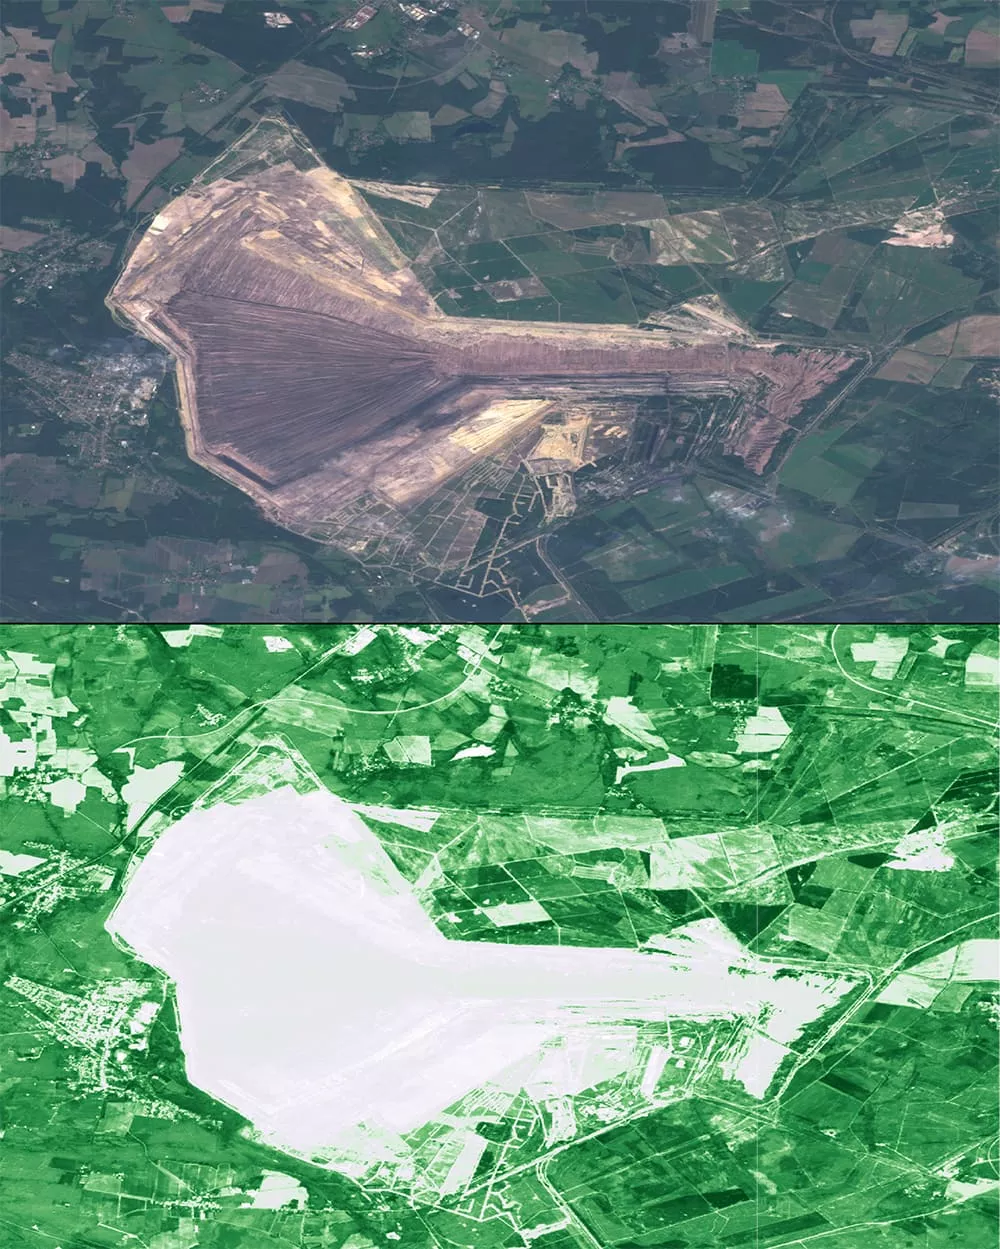
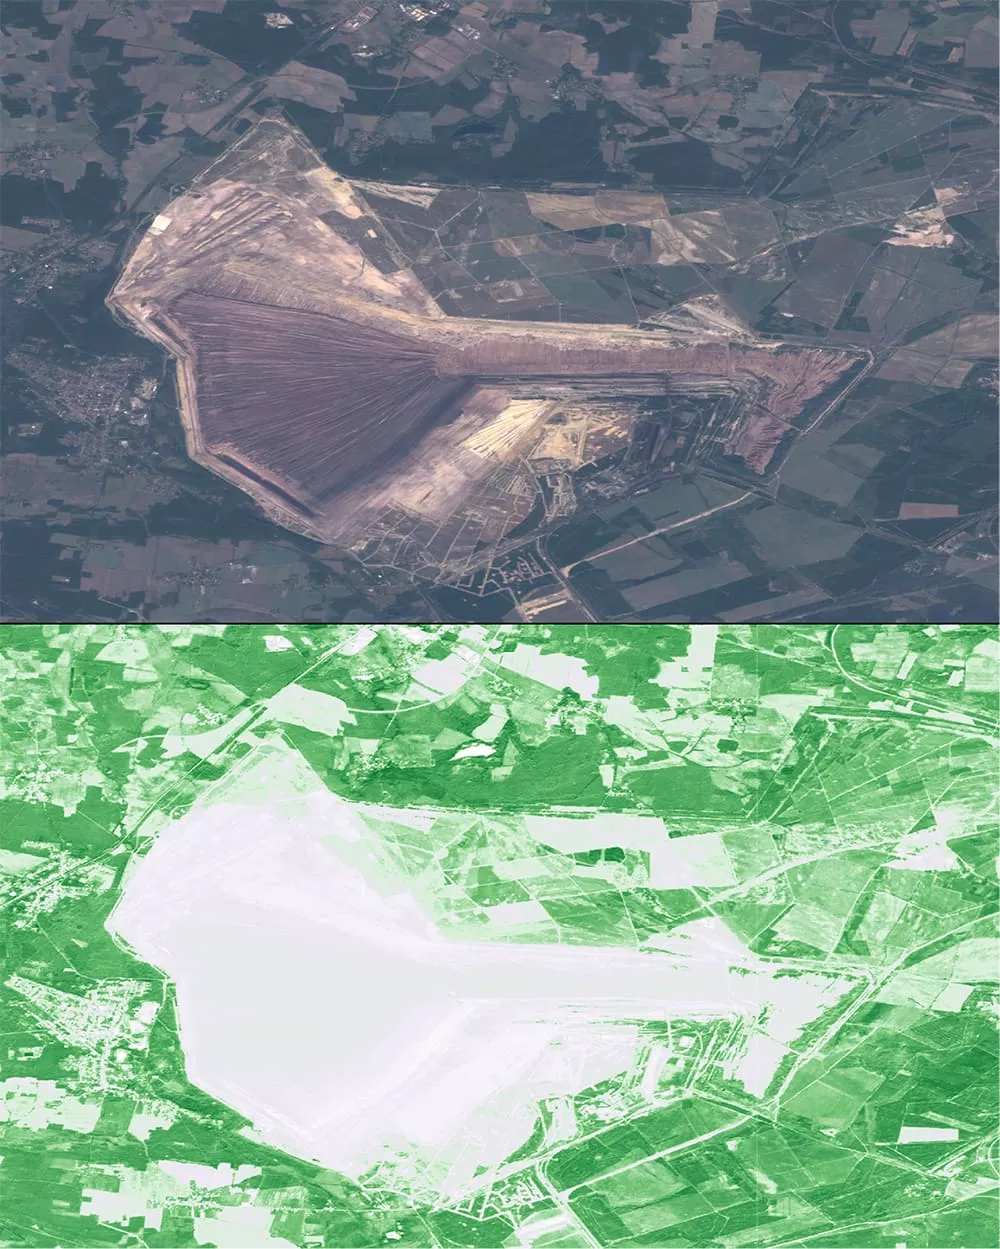
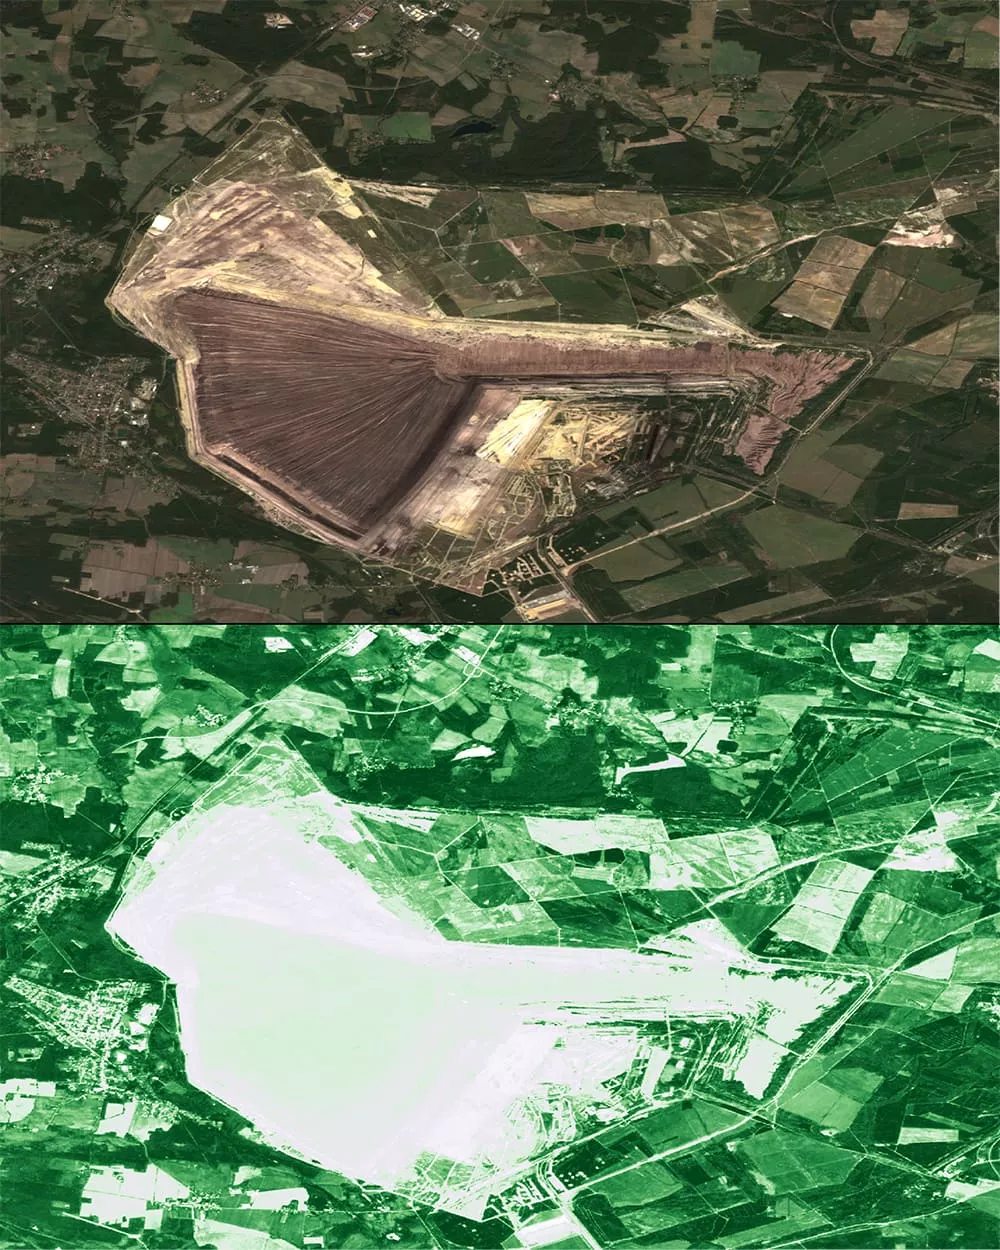
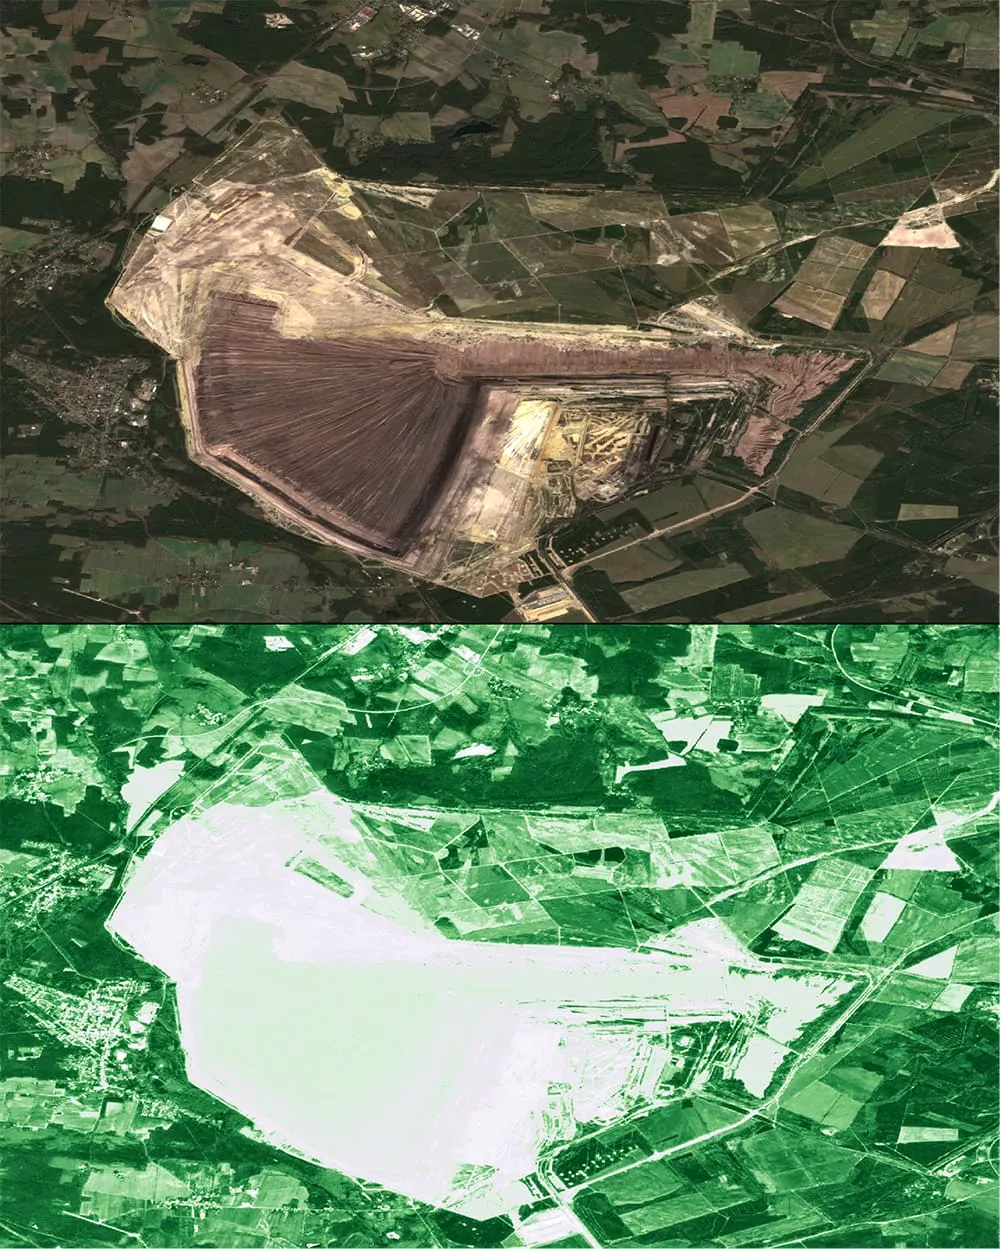
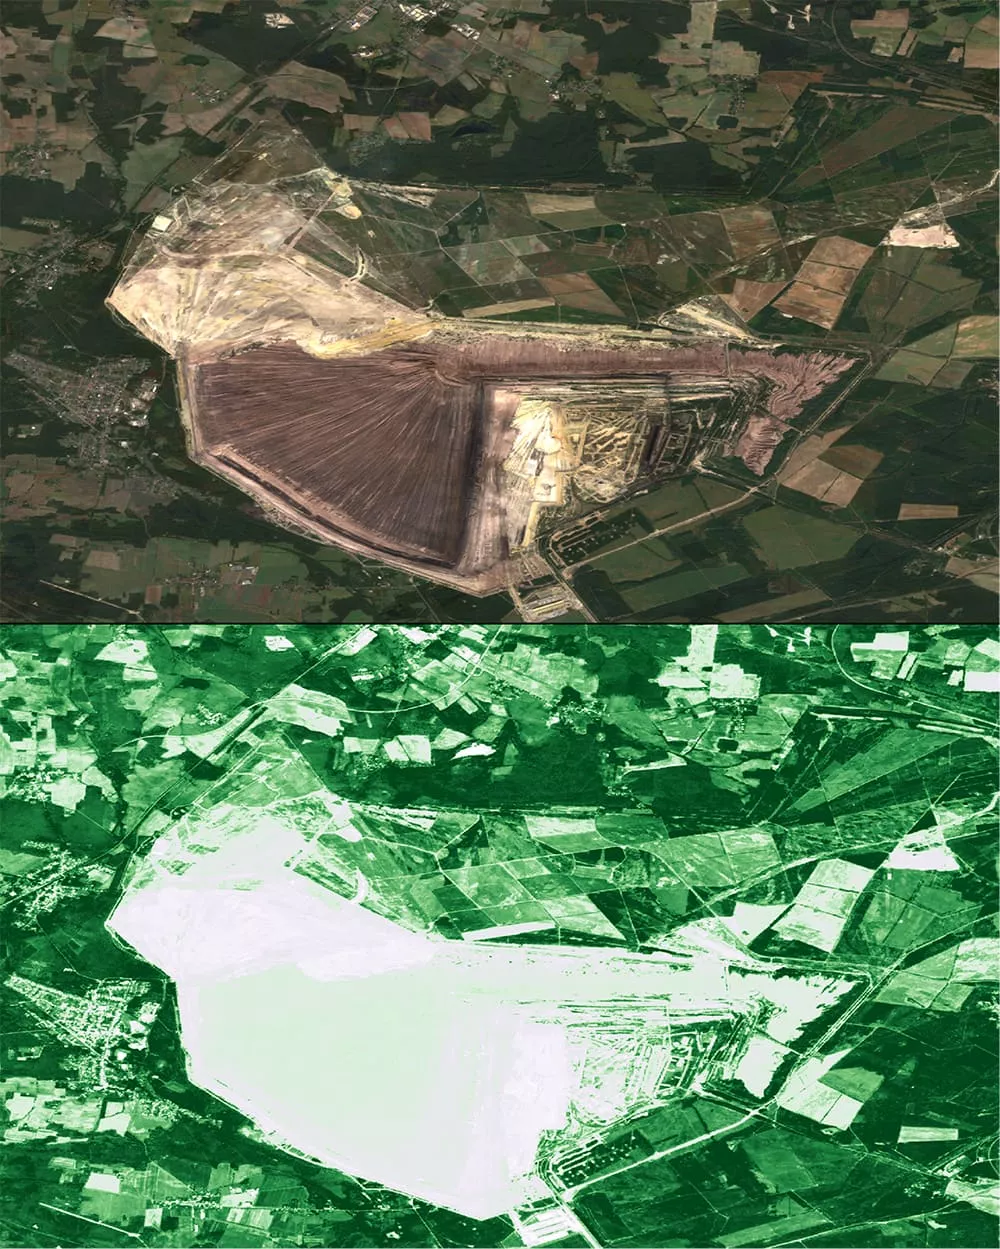
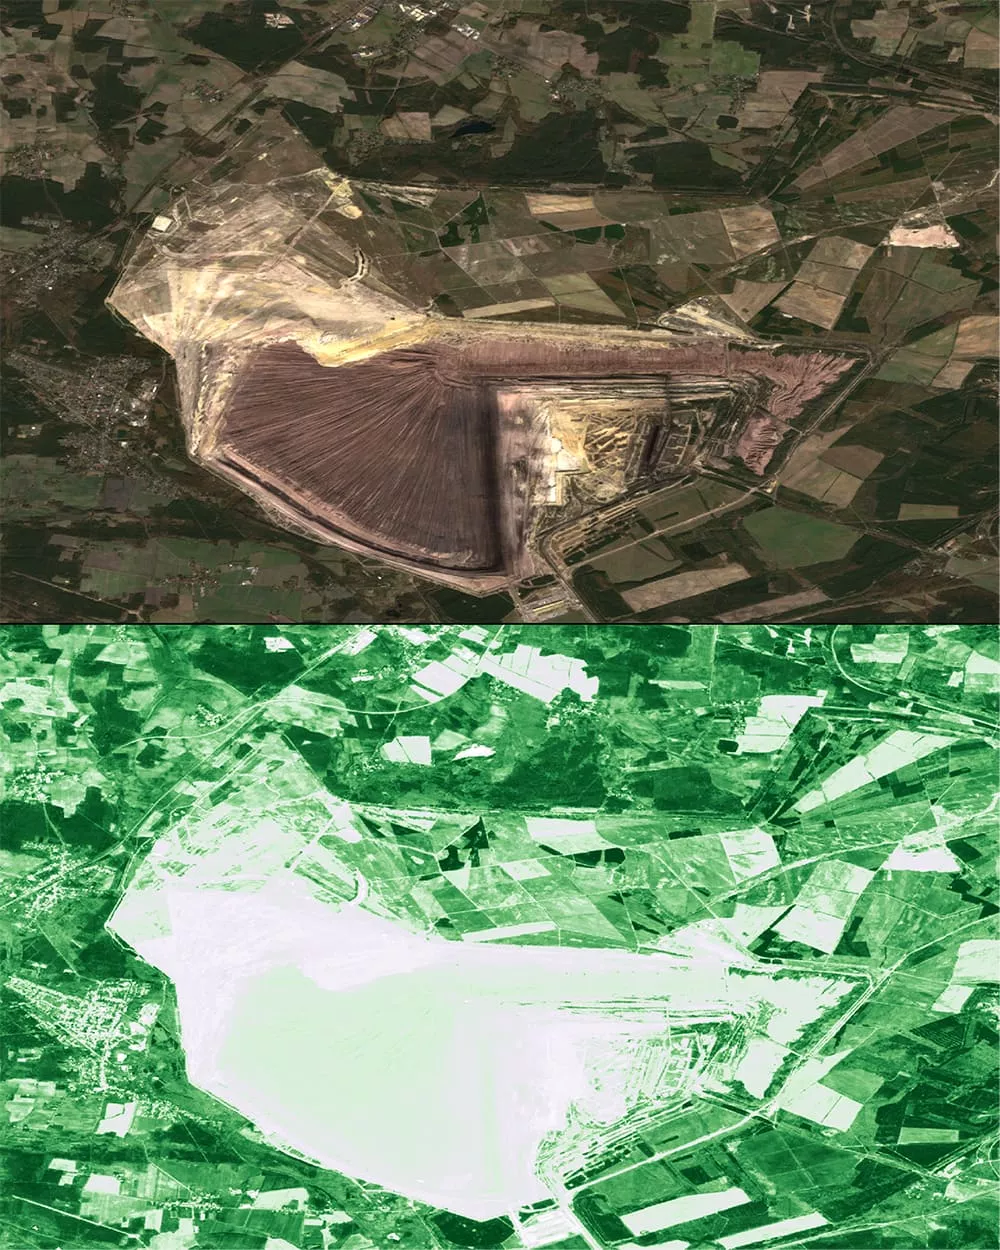
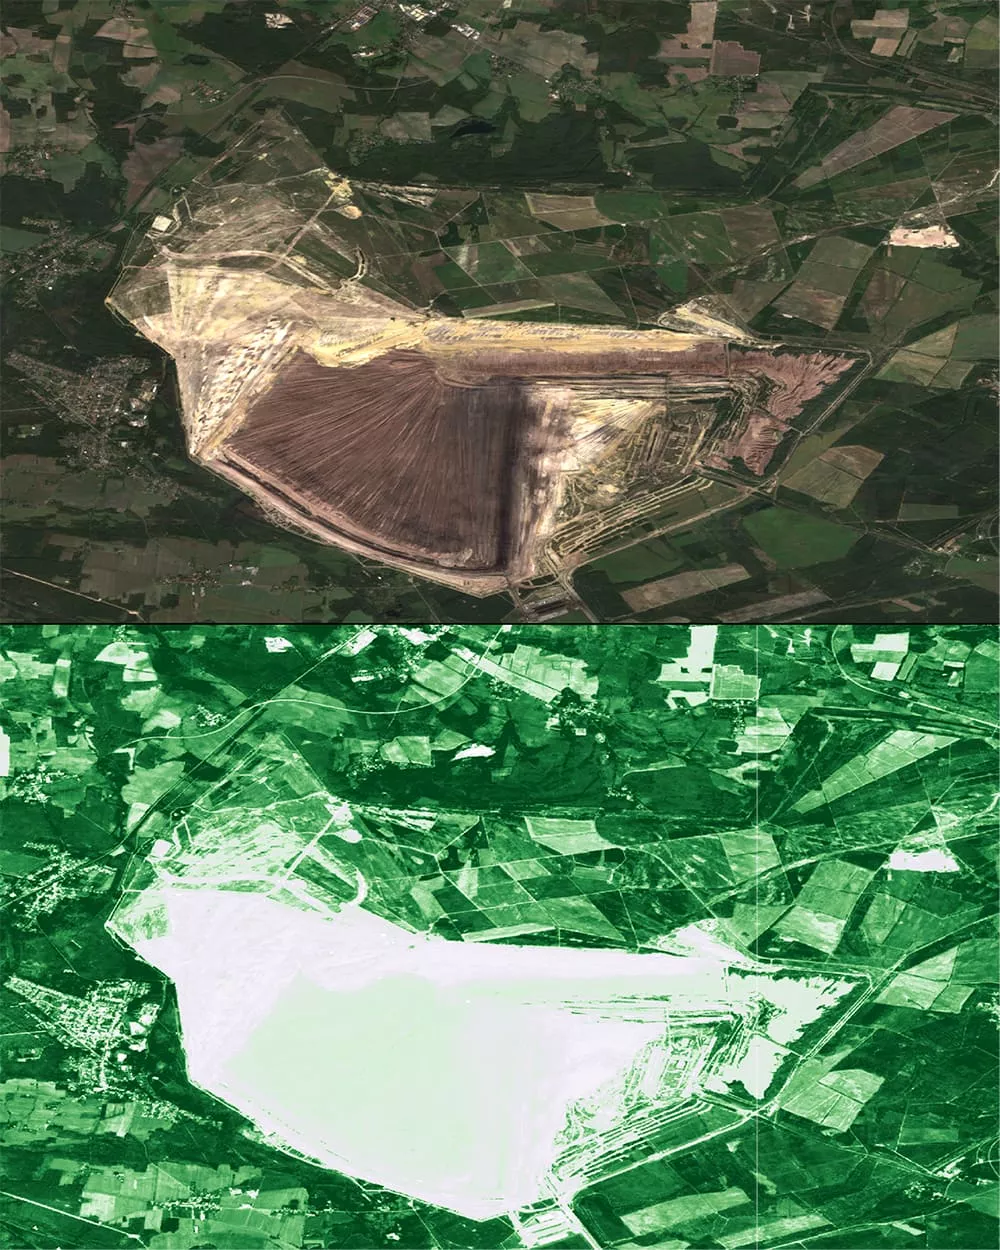
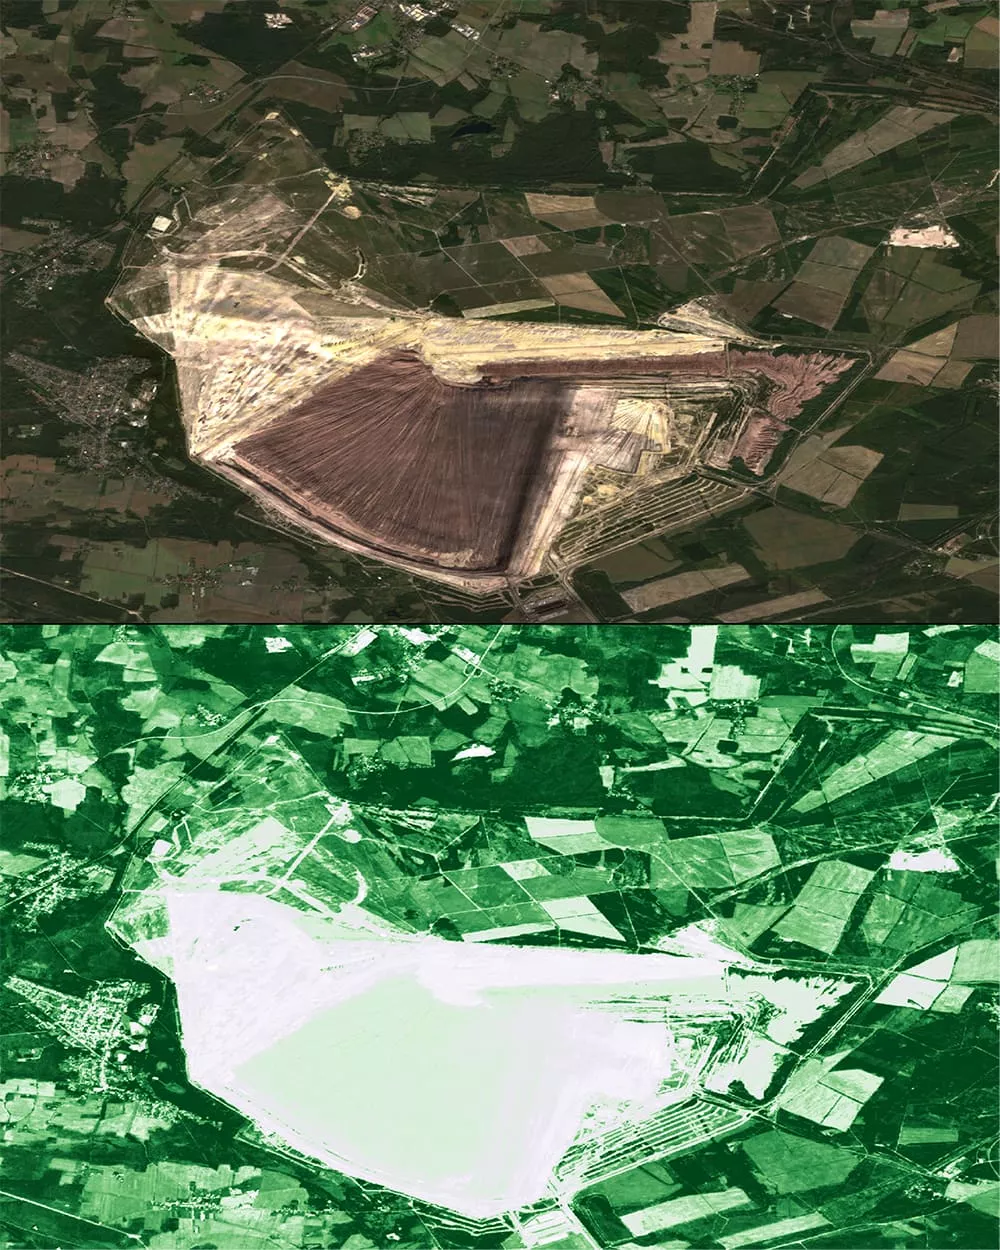
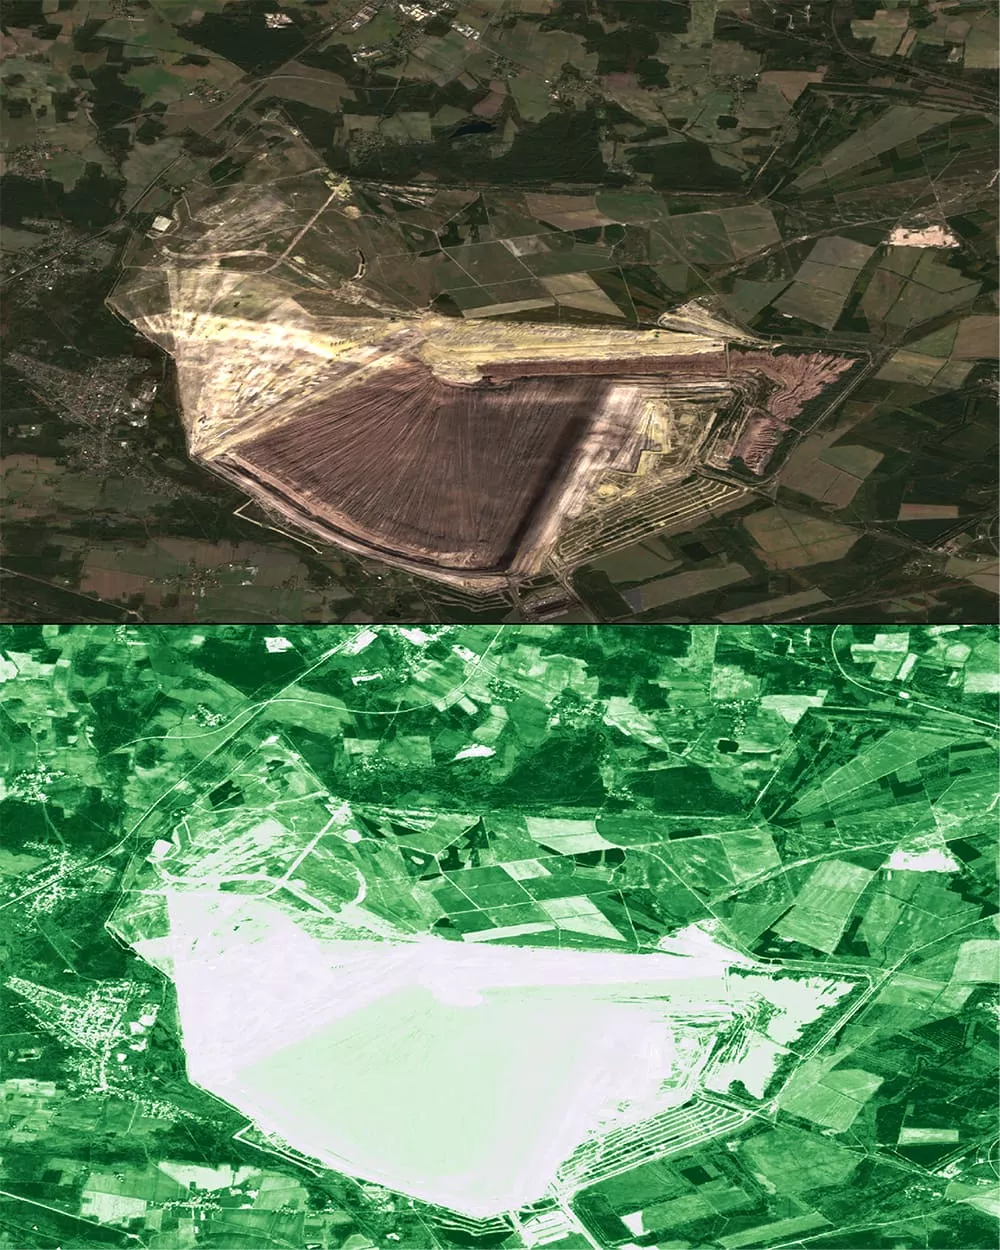
Welzow-Süd coal mine
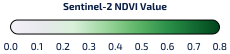
The time series shows the slow, but steady process of nature recovering over a segment of the Welzow-Süd mine, as viewed by the multispectral sensor of Sentinel-2 calculating the Normalized Difference Vegetation Index (NDVI).
Peak season revegetation (annual max km²)
This chart shows the maximum observed vegetated area each year, reducing the influence of within-year seasonal fluctuations and allowing clearer year-to-year comparisons of vegetation recovery across the quarry site. It provides an annual benchmark for assessing whether peak vegetation coverage is expanding, remaining stable, or declining, helping track longer-term revegetation trends and evaluate progress towards site rehabilitation.
Continuous revegetation area (km²)
By showing changes in vegetation area throughout the monitoring period, this graph helps identify periods of decline and recovery that annual peak values alone can conceal. The upward trend line provides a longer-term perspective on vegetation recovery, while sharp drops highlight periods requiring closer investigation to distinguish actual vegetation loss from seasonal effects or data limitations.
Who benefits
from Copernicus?
Through Copernicus data and services, stakeholders gain a consistent, auditable view of land‑cover/habitat change and restoration progress, and a clearer basis for prioritising field work and mitigation investments.
For a Mine Environmental Manager, the value of Copernicus can be summarised in three practical benefits:
More focused field campaigns
With Copernicus: the manager can screen the full site and surrounding areas regularly and send ecological teams first to the places where change appears most relevant.
Without Copernicus: the operator depends more heavily on broad, periodic field campaigns and
may spend time checking many areas that look stable while missing the ones that changed most.
Earlier detection of biodiversity-related risk
With Copernicus: the manager can spot disturbance, rehabilitation underperformance
or increasing proximity to sensitive habitats earlier.
Without Copernicus: the risks may only become obvious during the next surveys
or reporting cycle, when there is less time to adapt.
Stronger evidence for permits, ESG and stakeholder dialogue
With Copernicus: the mine operator has dated, repeatable and map-based evidence showing
where change happened and how the site evolved over time.
Without Copernicus: evidence is more fragmented and reactive, which can mean more verification rounds, slower internal decisions and weaker communication with regulators, investors and communities.
Taken together, these benefits make biodiversity monitoring more proactive. While Copernicus does not replace ecologists in the field, it can help the Environmental Manager use field monitoring more efficiently, more selectively and with a stronger evidence base.
In summary,
in business terms this can mean less time spent on broad field campaigns, better-targeted ecological surveys, and a stronger evidence base for permitting, ESG and stakeholder dialogue. Where the Environmental Manager uses Copernicus as a screening layer and reserves field work for the most relevant locations, biodiversity monitoring becomes more proactive, more selective and easier to defend, without replacing ecologists in the field.
Explore this
further with us
Do you have questions about biodiversity impacts, rehabilitation recovery, or growing proximity to protected areas? Explore free Copernicus data as a practical first screening layer for your biodiversity monitoring approach.
EUSPA can help interested stakeholders explore which Copernicus datasets and indicators are most relevant for their operational needs, and how they can be turned into dashboards, alerts or reporting tools together with EO service providers.