Physical risk assessments for energy assets
- Energy
Europe’s transmission and distribution operators face climate-driven physical risks to the grid, such as floods and fires. Here is how Earth observation turns that uncertainty into asset-level intelligence.
€
-
billion
in economic losses from weather- and climate-related extremes that struck Europe between 1980 and 2024. Around a fifth of it occured in just the last few years.
EU Energy Landscape
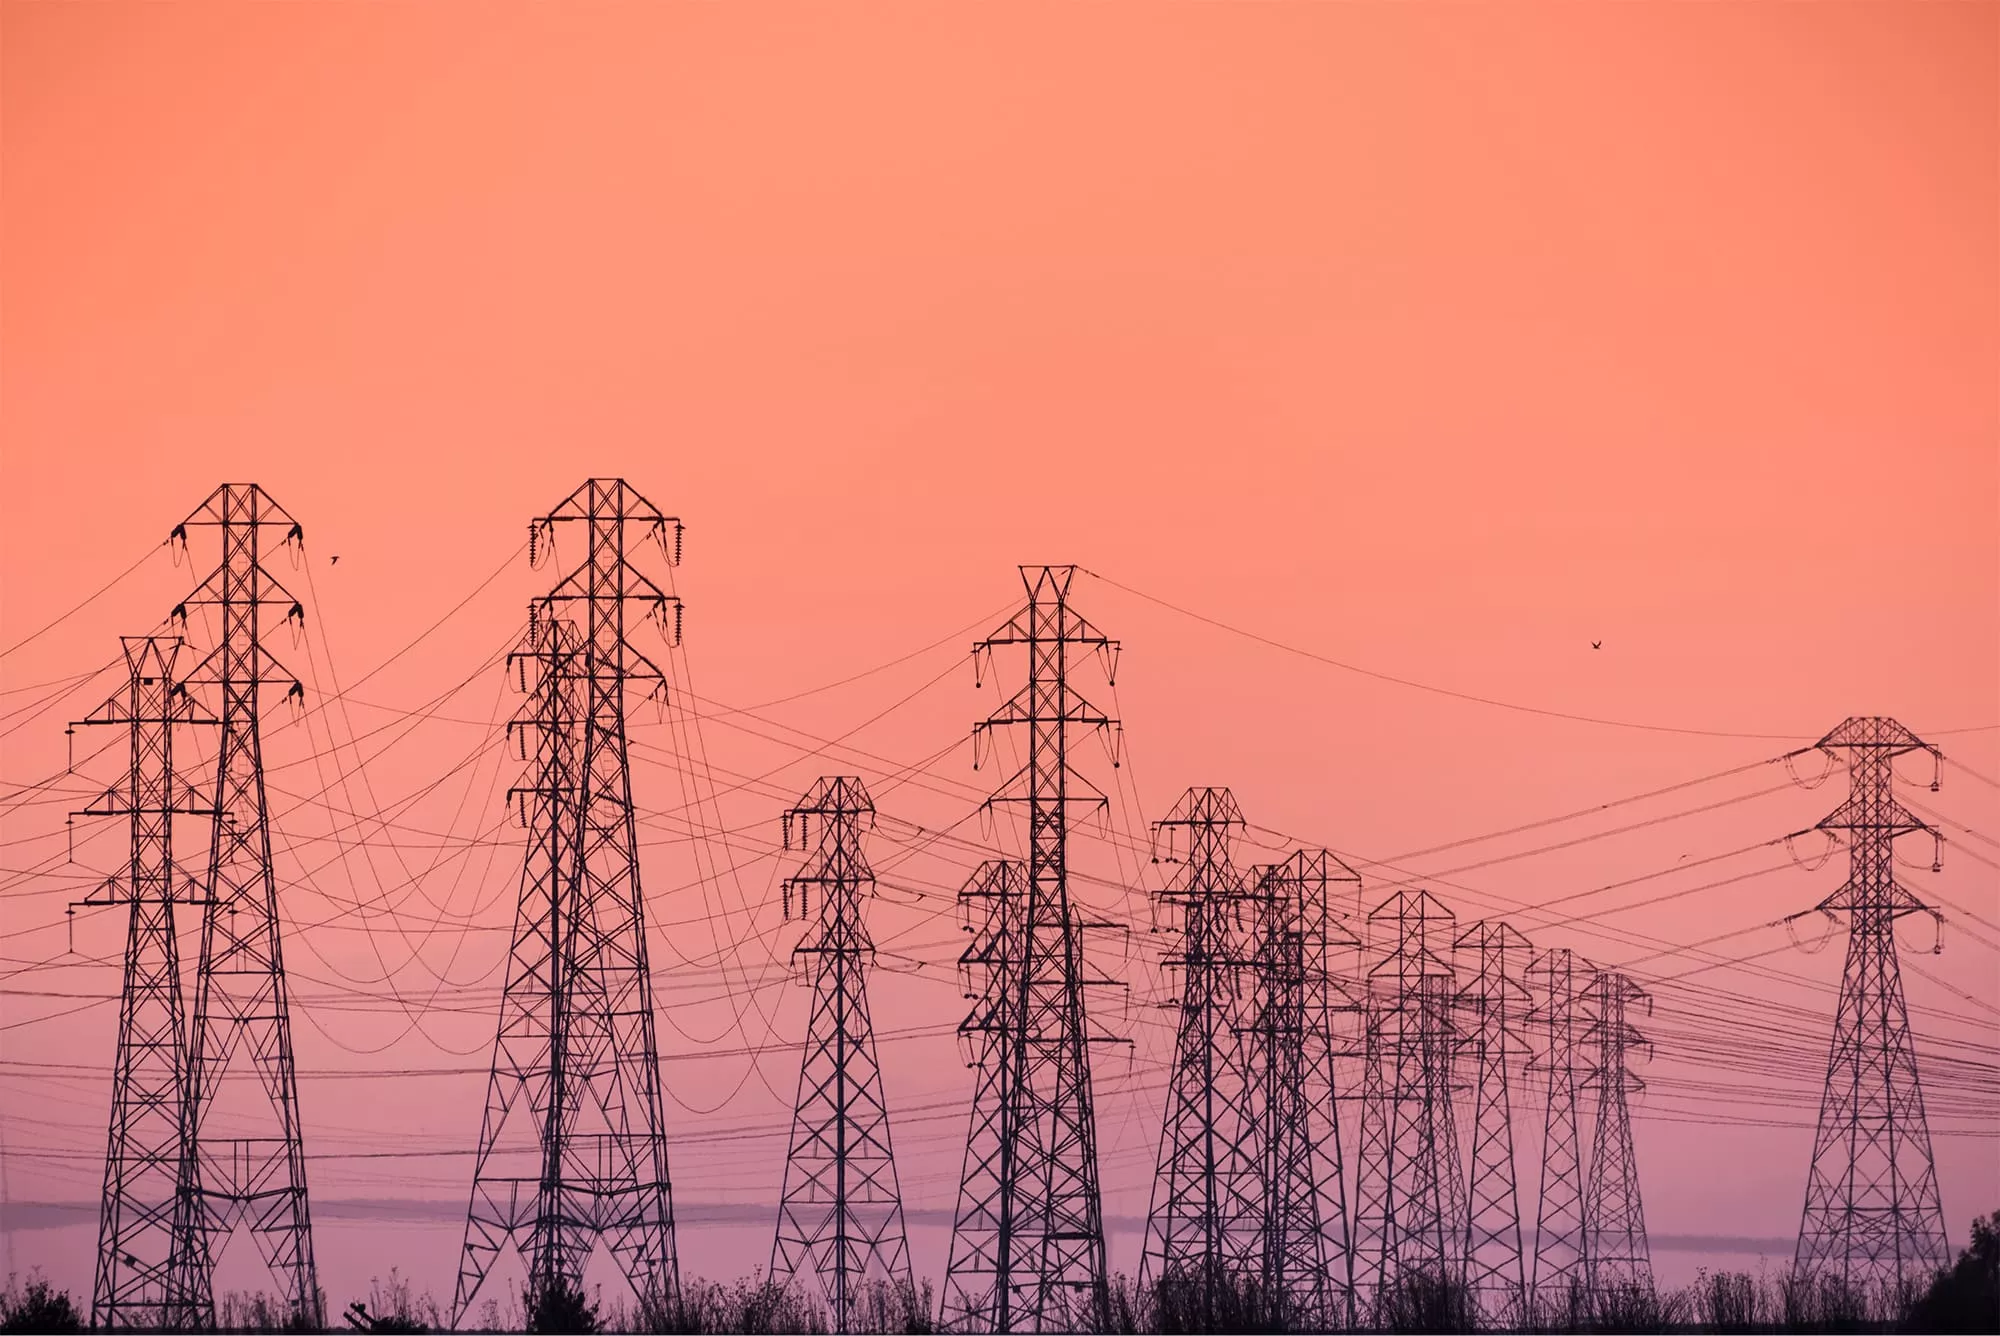
The European energy system is the backbone of the continent's economic security, yet it is increasingly challenged by climate change induced physical risks.
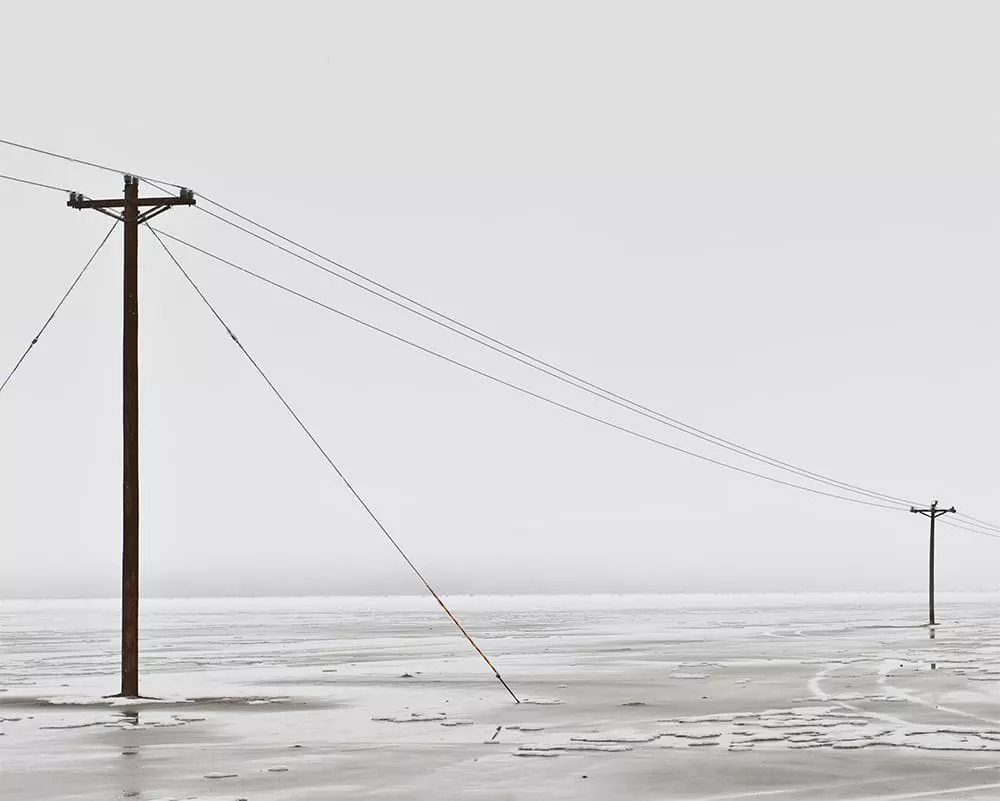
While hazards like flooding and wildfires have always been managed by Transmission and Distribution System Operators (TSOs and DSOs), the frequency and intensity of these extreme events is rising and testing historical parameters used for grid design.
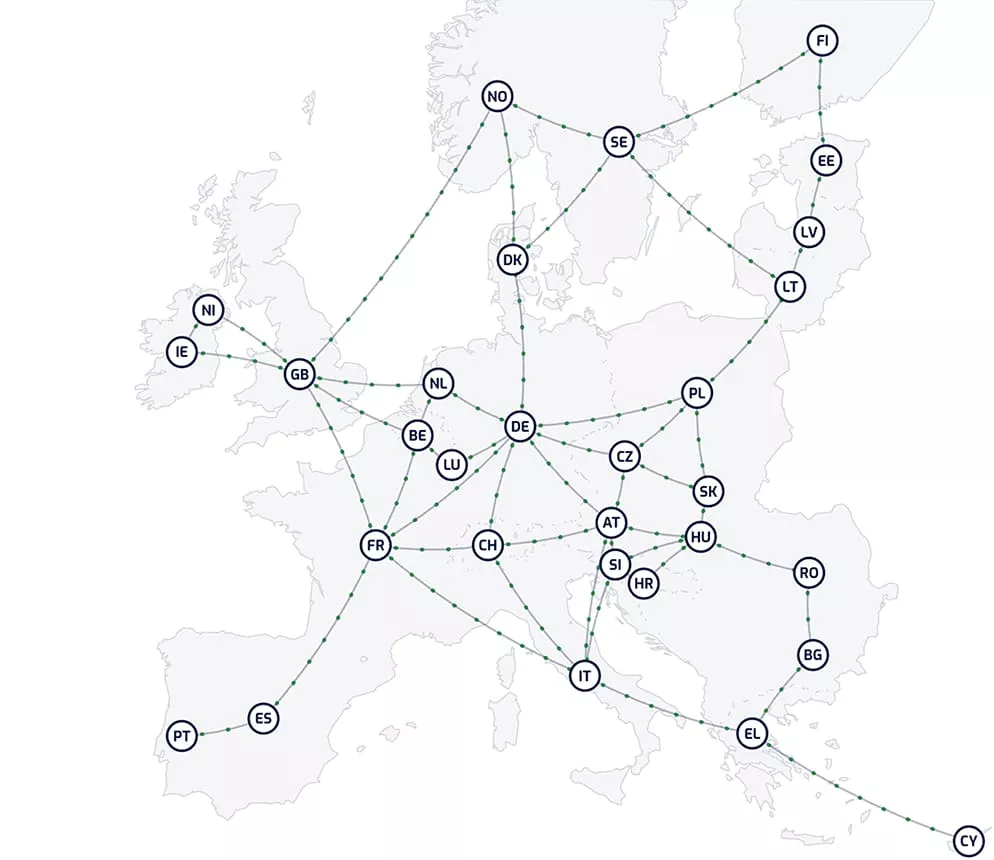
TSOs and DSOs are responsible for thousands of kilometres of infrastructure, with limited incorporation of evidence-based climate risk data in current workflows, so the maintenance is usually reactive instead of proactive. New grid expansions furthermore need to take climate risks into account.
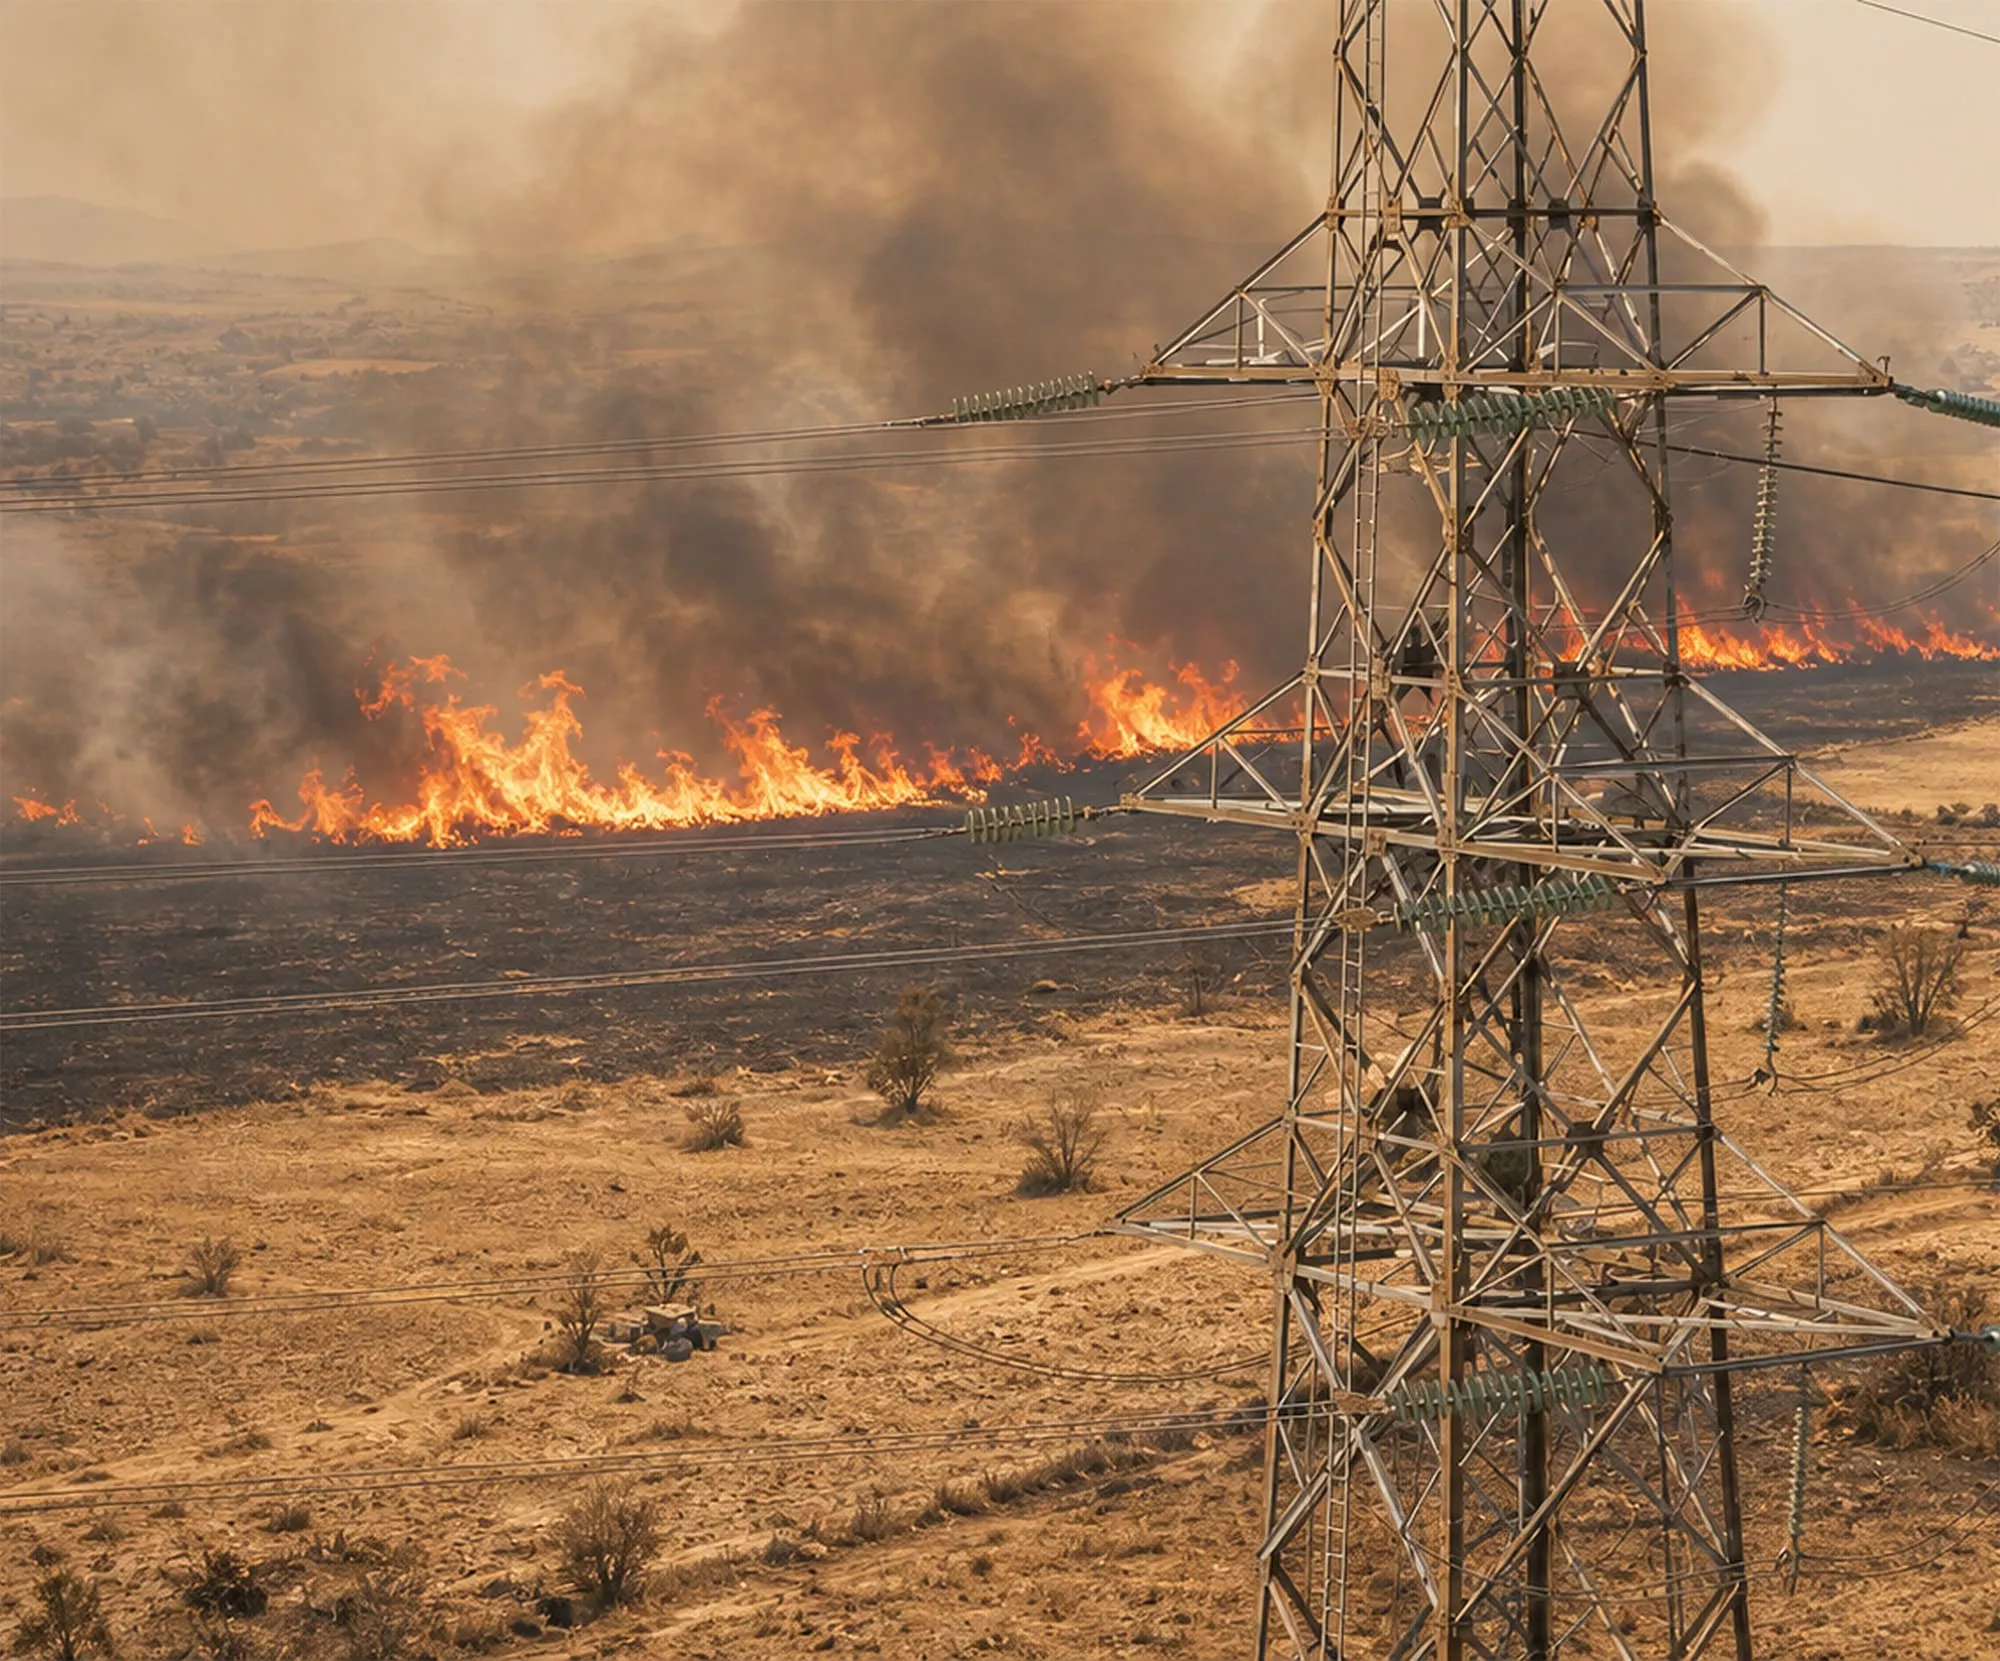
Cumulative Effects of Climate Change
Grid resilience has long rested on engineering standards built around 50- or 100-year return periods for floods and extreme wind. Those standards assume a stable climate. They no longer hold.
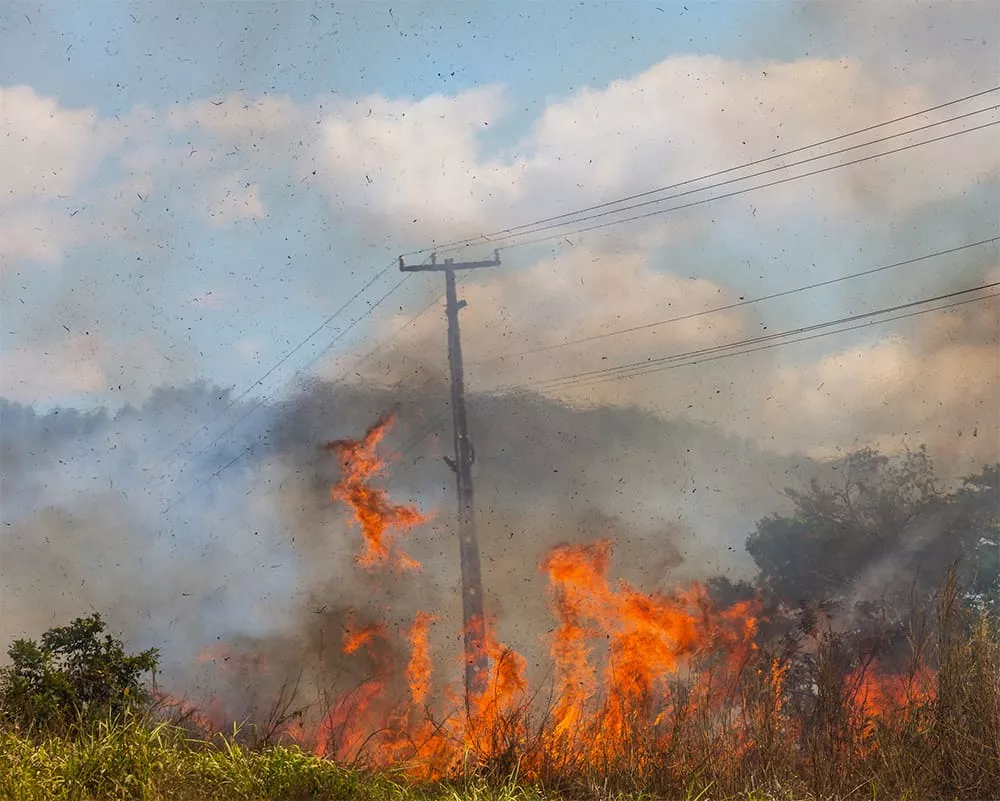
Climate change does not arrive as a single, neat hazard. It compounds. Prolonged drought builds extreme fuel loads, which combine with dense vegetation to raise wildfire risk. Heat stress, flooding, and extreme wind layer on top, often hitting the same assets in the same season. Grid infrastructure faces not one threat but several at once.
This story follows that risk from cause to consequence: from climate hazard, to the exposure of specific grid assets, to the operational decisions and actions that follow. By turning continuous, wide-area Copernicus observations into a single multi-hazard view, operators can move from a reactive cycle, repairing damage after it occurs, to identifying the precise segments of the network where vulnerability is building, and acting before failure.
Reported flood events in Europe, 1950–2020
Annual count with 10-year rolling average - a rising trend
Source: HANZE v2.1 (Paprotny et al., 2024)
Flood Impacts on Grid Management
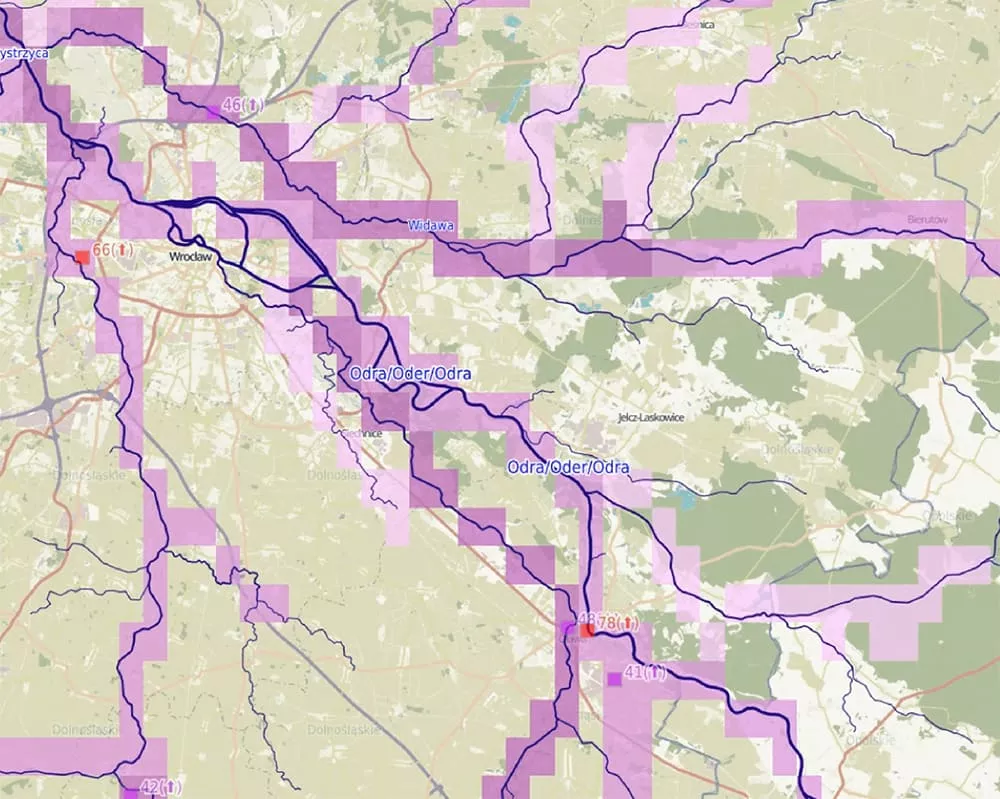
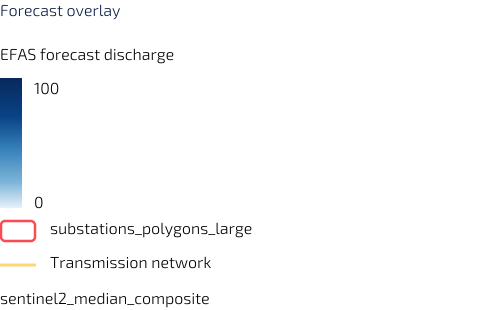
Managing flood risk in a more volatile climate requires moving beyond local gauges to upstream catchment intelligence. The European and Global Flood Awareness Systems (EFAS and GloFAS) provide the forecasting needed to anticipate riverine flood peaks before they reach critical infrastructure.
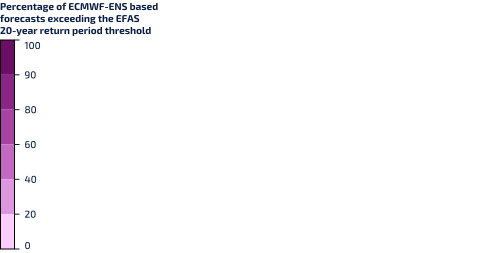
When integrated into SCADA systems of transmission and distribution grids, these probabilistic forecasts can be spatially matched to asset inventories in real time.
This allows TSOs to anticipate the impact on specific substations and corridors, enabling the strategic deployment of personnel for inspections or pre-emptive grid management (e.g. isolate or reroute assets).
From flood forecast to grid action
Five-step workflow integrating EFAS / GloFAS forecasts into TSO decision-making, with a satellite-based verification loop
Source: Copernicus EFAS & GloFAS (JRC, ECMWF); Sentinel-1/2 (ESA Copernicus): TSO/DSO asset data
As heatwaves and droughts intensify, the risk of wildfire-driven grid failure has moved from a regional concern to a systemic European threat. The European Drought Observatory (EDO) and European Forest Fire Information System (EFFIS) available through the Copernicus Emergency Management Service (CEMS), in combination with Copernicus Land Monitoring Service (CLMS) datasets on vegetation height and biomass, provide the critical indicators for fire danger and fuel availability.
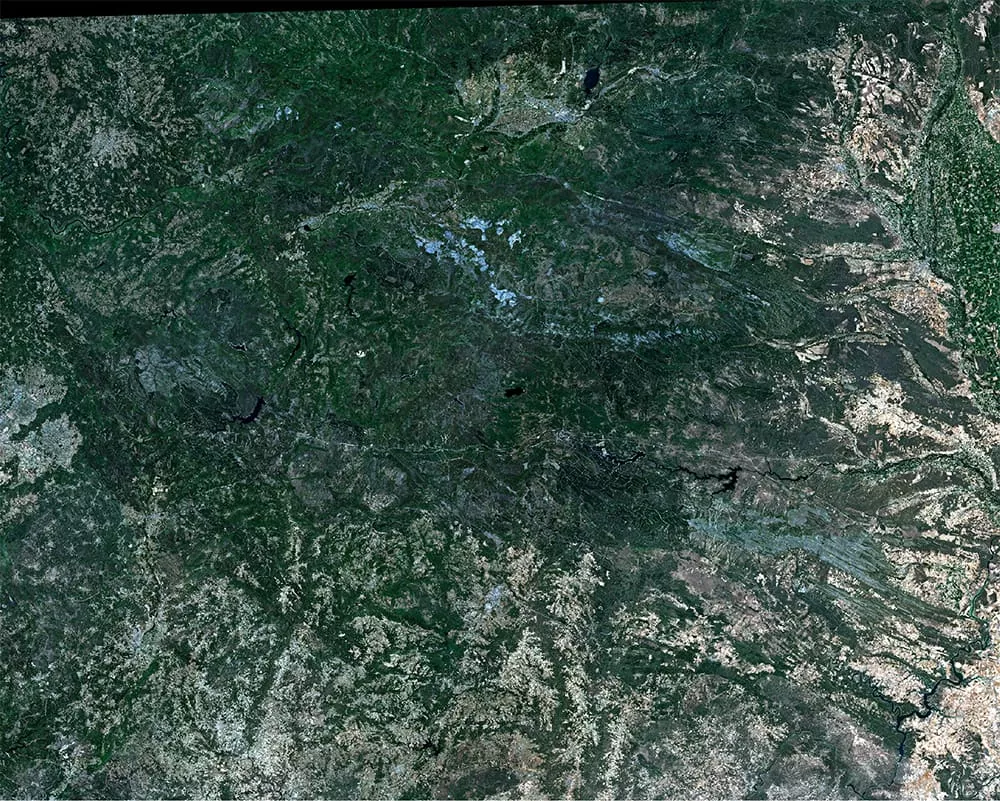
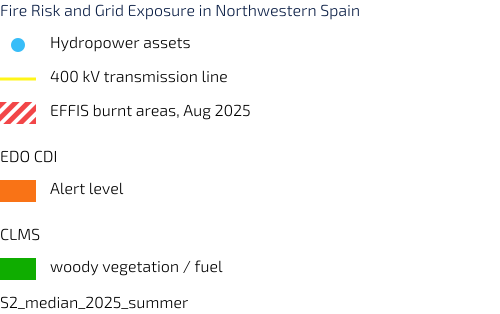
Base Context (Sentinel-2)
High-resolution optical imagery providing the baseline geographical context and surface visualisation of the forested grid corridors.
When these data streams are ingested into SCADA systems, the operators gain the ability to model the propagation of fire risk across forested corridors and to simulate the thermal stress on overhead lines under extreme heat scenarios. This integration supports proactive vegetation management, the identification of high-vulnerability segments, and the planning of temporary load reductions or line de-energisation.
Put simply, Copernicus pinpoints where vegetation and drought raise fire risk. A digital twin turns that signal into a ranked list of which corridors to clear first.
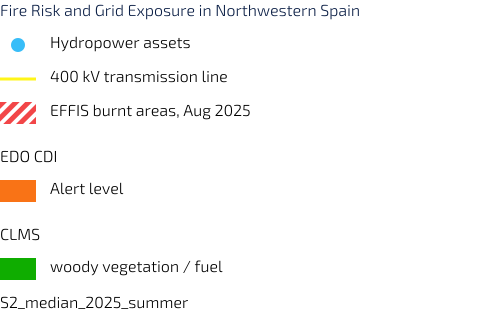
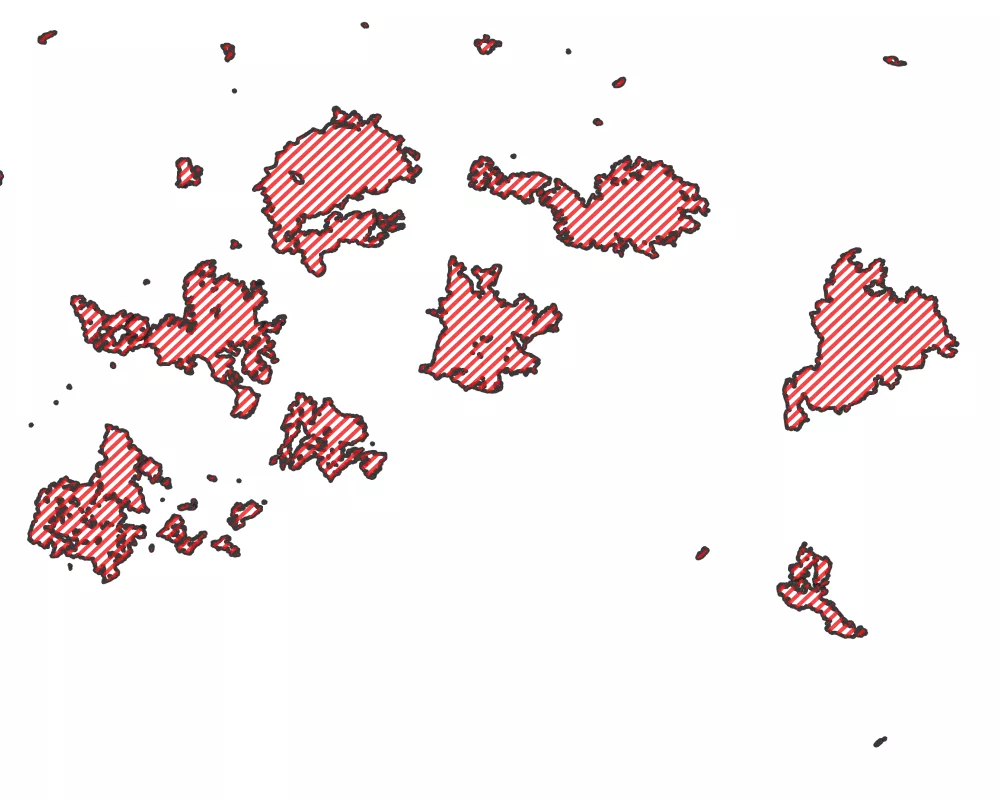
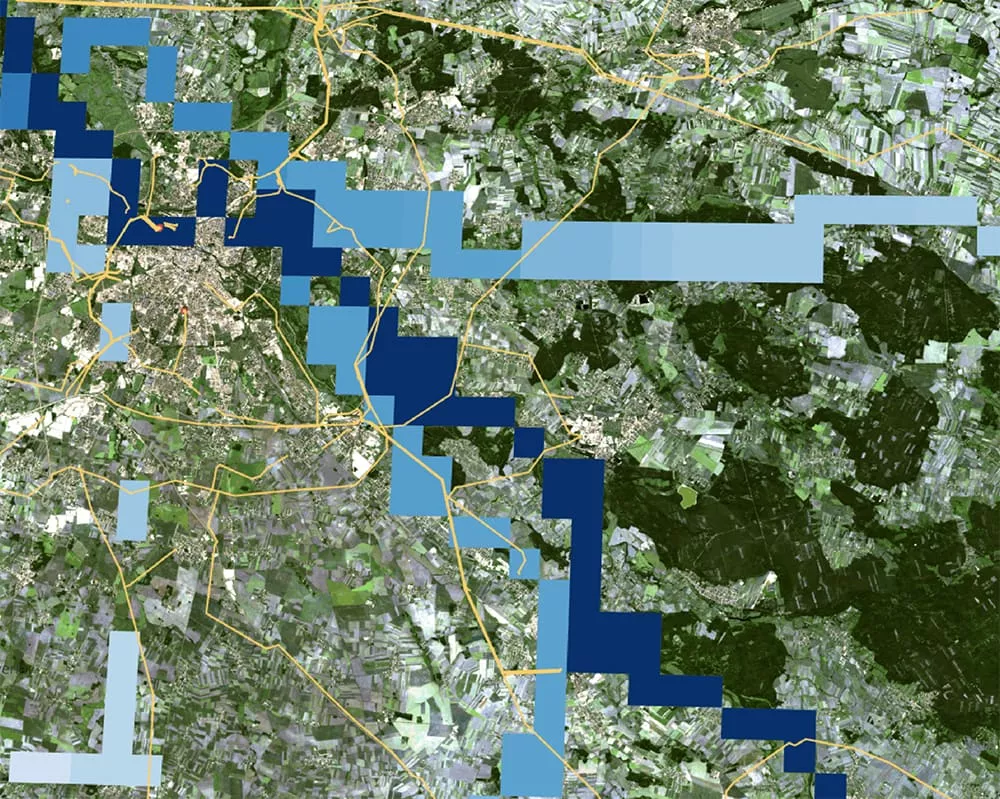
Fire Mapping (EFFIS) Active and recent wildfire burn footprints (August 2025 data) utilised to identify physical threats directly boundary-crossing into the grid.
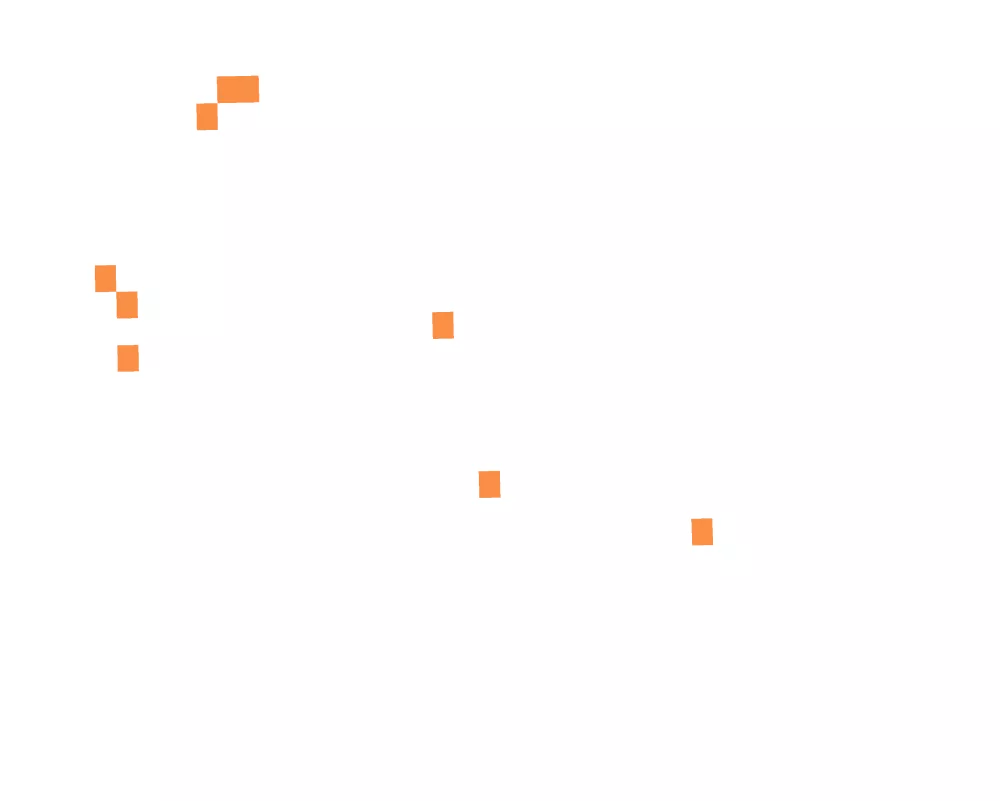
Climatic Stress (EDO CDI)
Combined Drought Indicator (CDI) layers mapping soil moisture deficits and drought alerts that indicate critical fuel flammability.
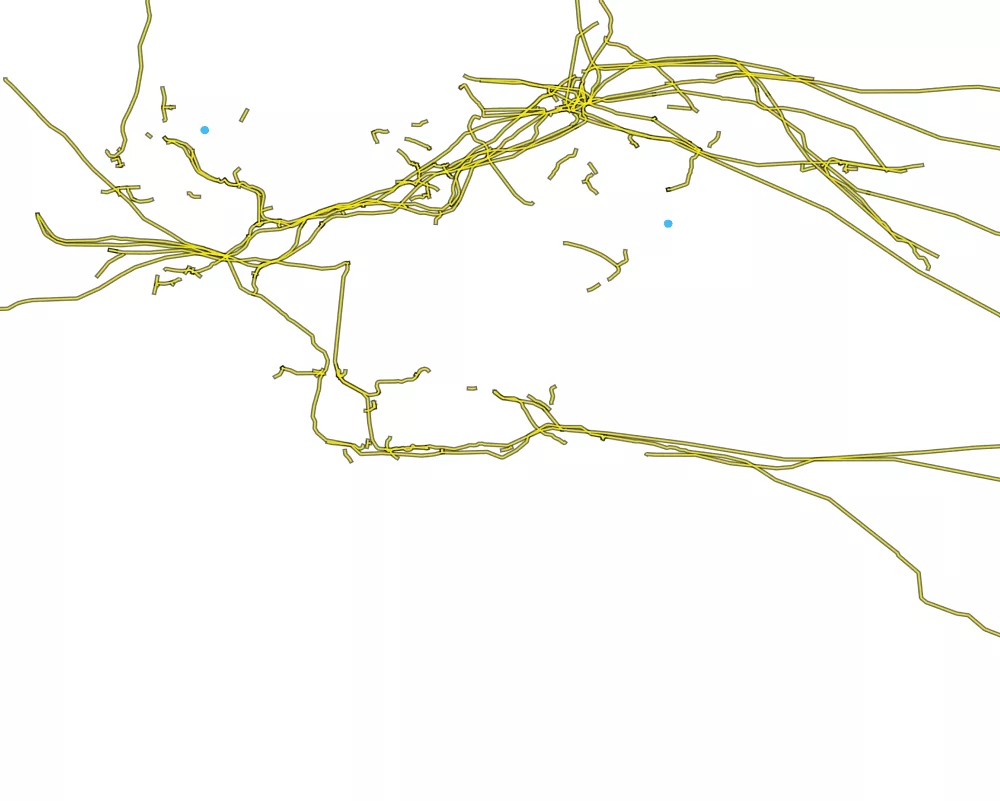
Critical Assets (Infrastructure)
Geospatial overlay of strategic 400 kV transmission lines and hydropower networks exposed to environmental hazards.
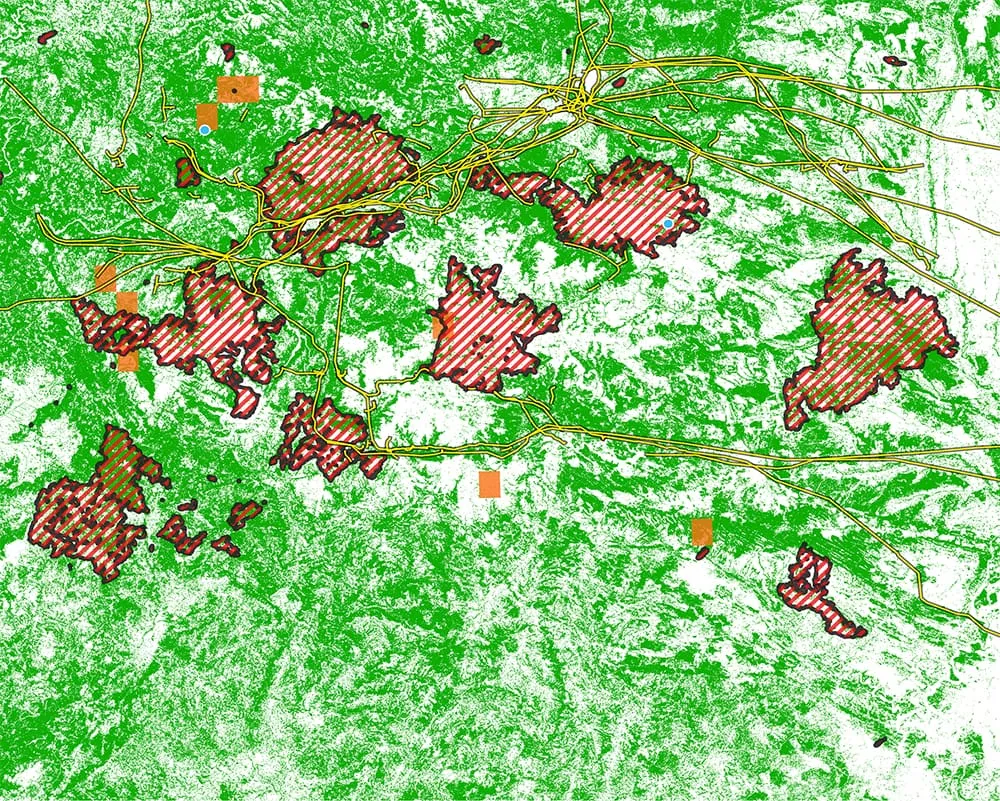
Risk Synthesis (All combined)
Multi-criteria integration of Copernicus data streams, automatically isolating grid segments with maximum operational vulnerability.
Sentinels for Grid Management
When regional early-warning systems flag elevated hazard conditions, Copernicus Sentinel satellites provide the high-resolution evidence required for asset-level management and planning.
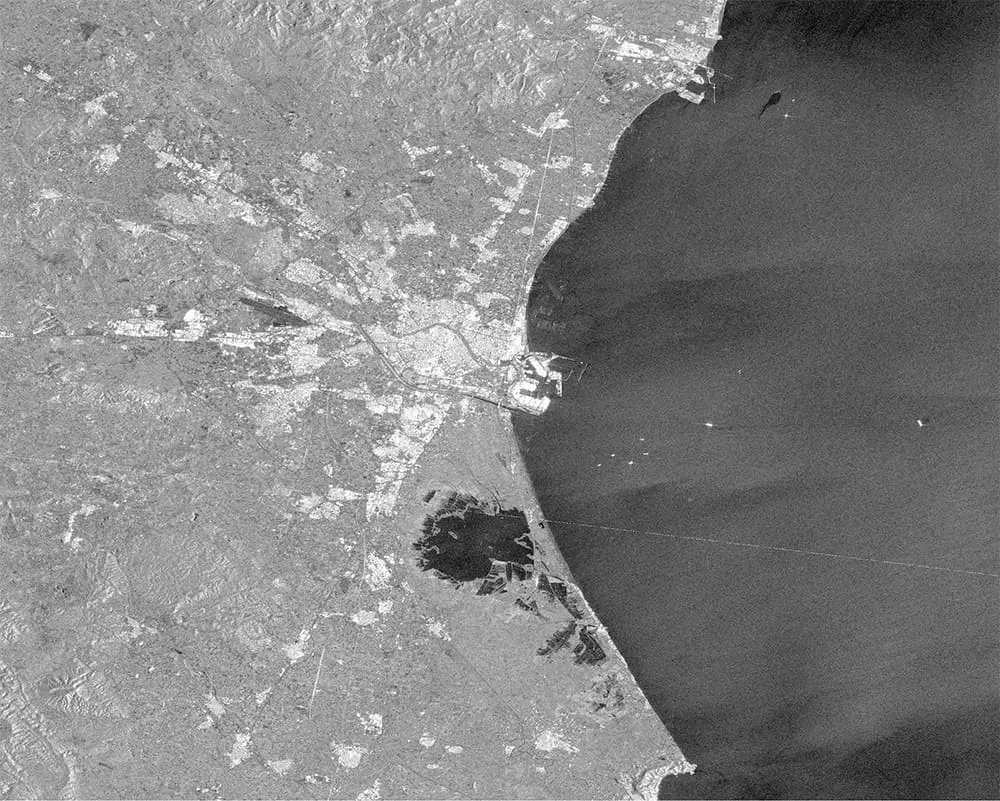
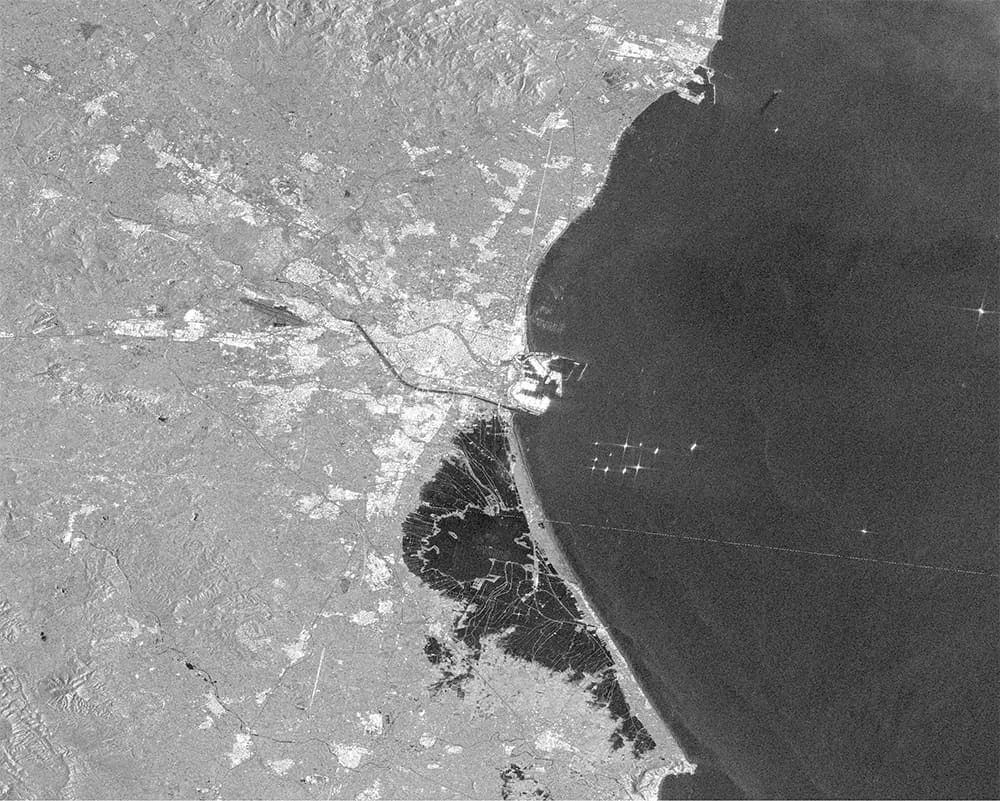
Sentinel-1 radar data, unaffected by clouds or weather, enables the rapid mapping of floods.
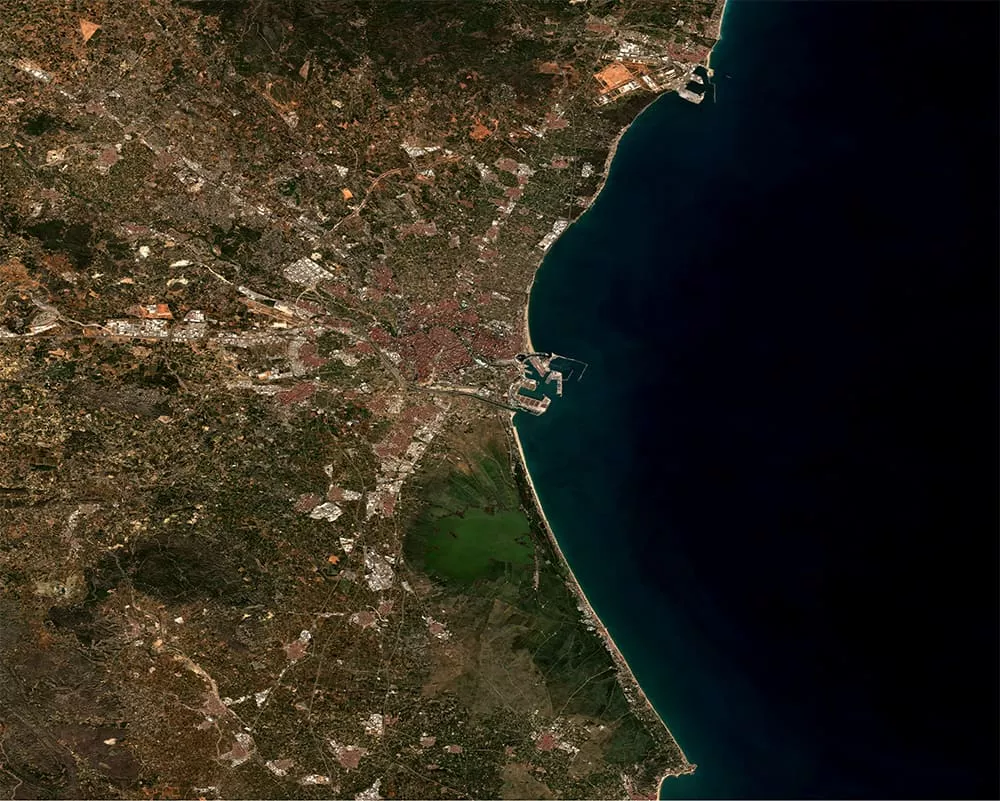
Sentinel-1 radar capabilities allow for the mapping of flood extent and water persistence around tower bases, even through heavy cloud cover.
Optical Baseline (Sentinel-2)
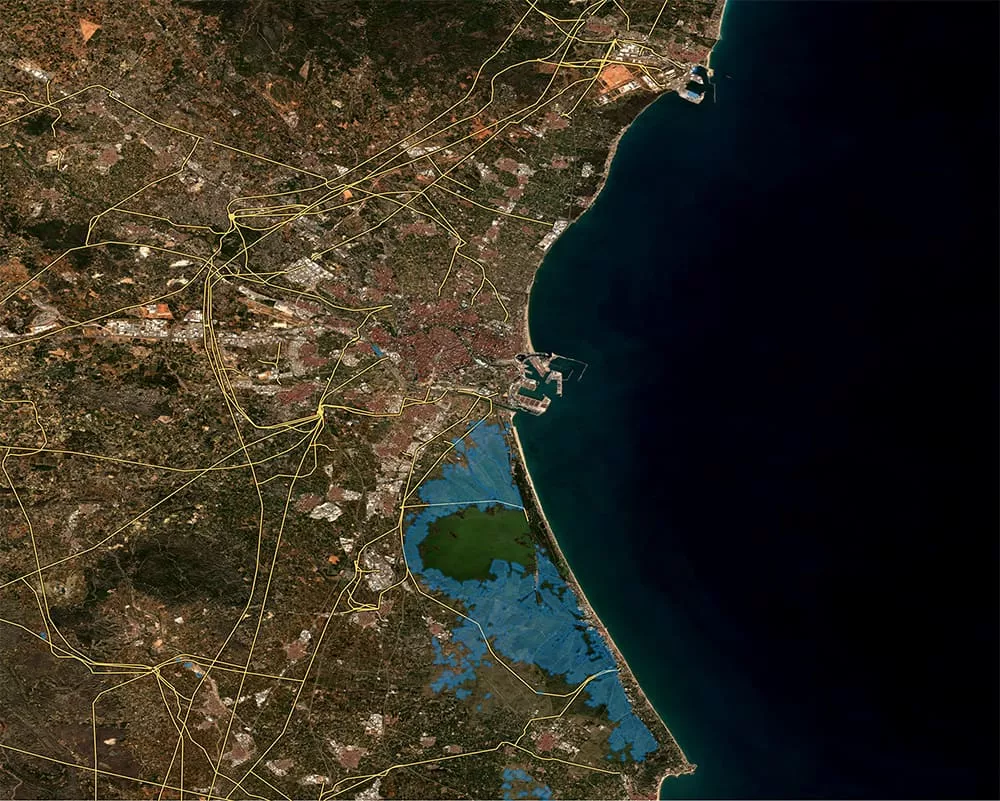
A cloud-free true-colour composite covering August to December 2024. It provides the permanent surface context, showing the coastal zone of Valencia and the Albufera lagoon prior to and after the event.
Radar Flood Extraction (Sentinel-1 SAR)
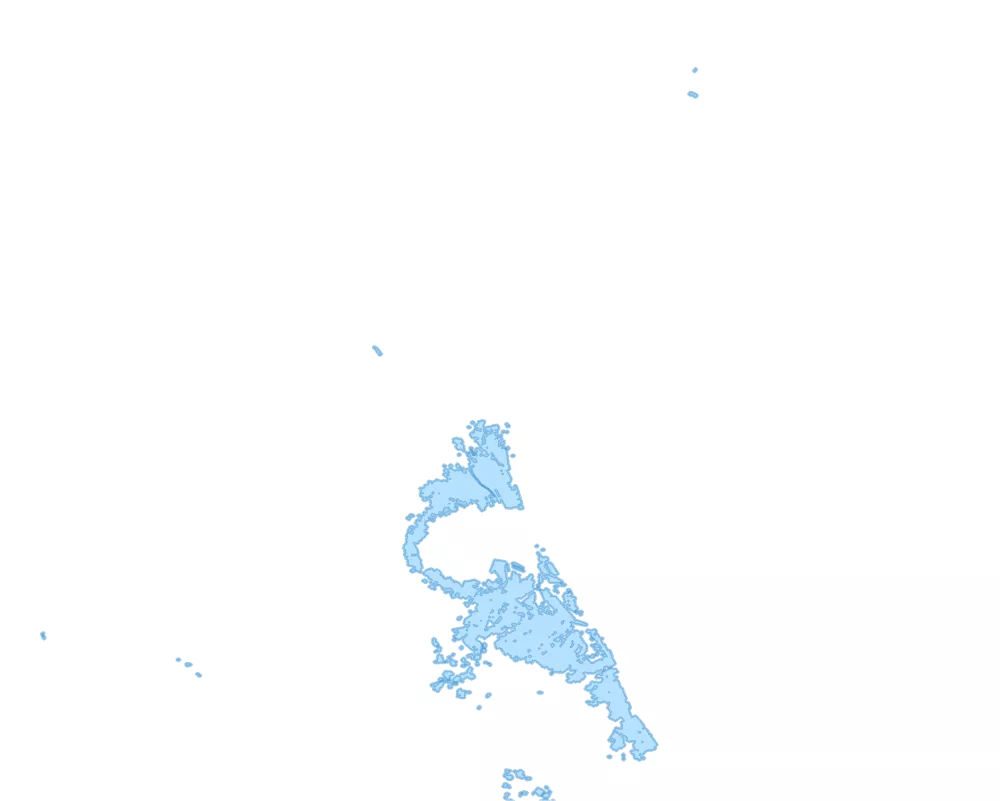
Active flood footprint mapped by analysing the backscatter intensity delta between pre-flood (15–22 October 2024) and post-flood (29 October–3 November 2024) Sentinel-1 radar images. Radar wavelengths cleanly penetrate cloud cover to capture the exact water extent over the Albufera lagoon.
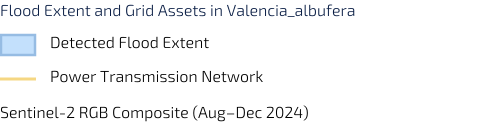
Integrated Exposure Synthesis (All Combined)
The final multi-sensor integration combining the Sentinel-2 optical background, the Sentinel-1 radar-extracted flood boundaries, and critical infrastructure vectors. This operational synthesis automatically flags where the flood extent intersects the raw powerline network, providing grid asset managers with the localised situational awareness needed to prioritise emergency maintenance and power rerouting.
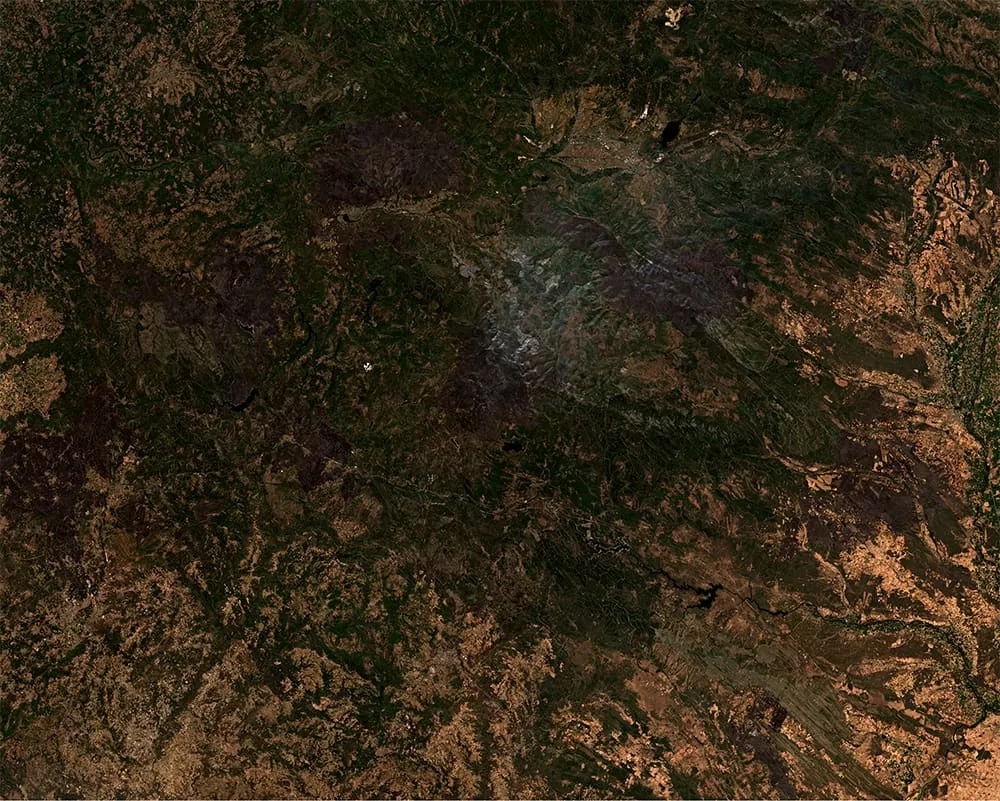
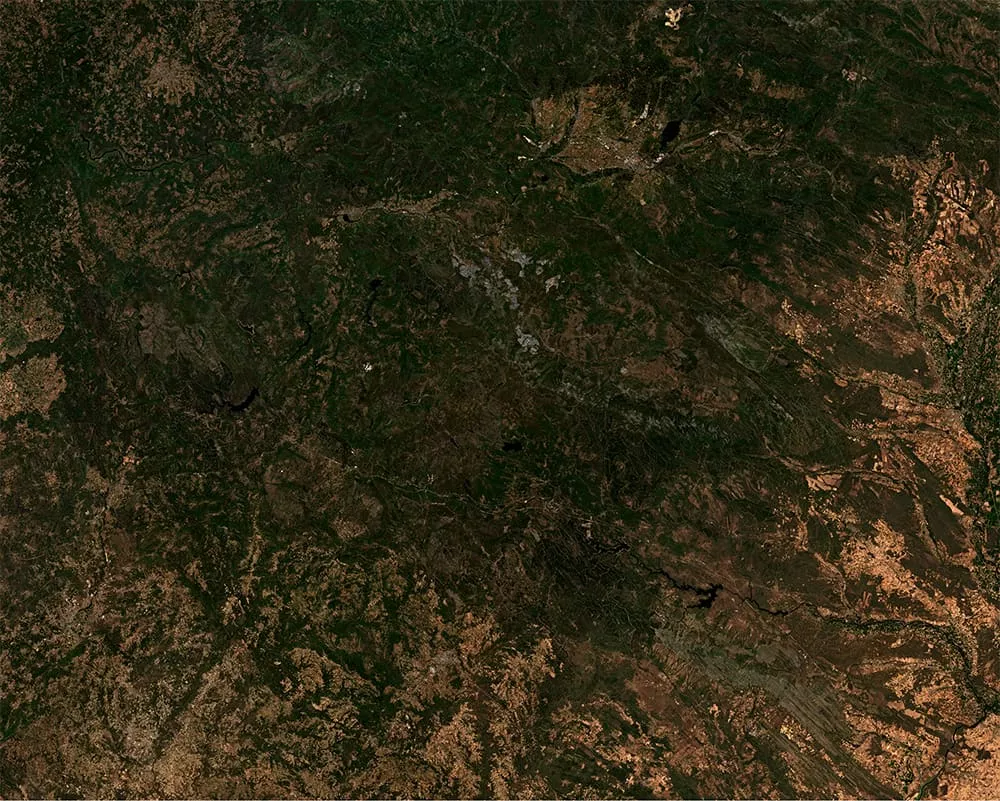
Simultaneously, Sentinel-2 optical imagery provides the precision needed to map burn scars and vegetation loss following a fire.
These observations enable operators to continuously monitor condition of assets in near real time, triggering automated inspection workflows and updating structural integrity models for affected towers, poles, and access infrastructure.
Post-Event Monitoring (Post-fire Sentinel-2)
High-resolution optical imagery captured after the wildfire event. Spectral changes and dark burn scars are visibly apparent, mapping the actual geometric path and physical impact of the fire across the terrain.
Environmental Baseline (Pre-fire Sentinel-2)
True-colour optical imagery establishing the healthy, pre-event vegetation state. This baseline serves as the radiometric reference needed to calculate fire severity and vegetation loss indices.
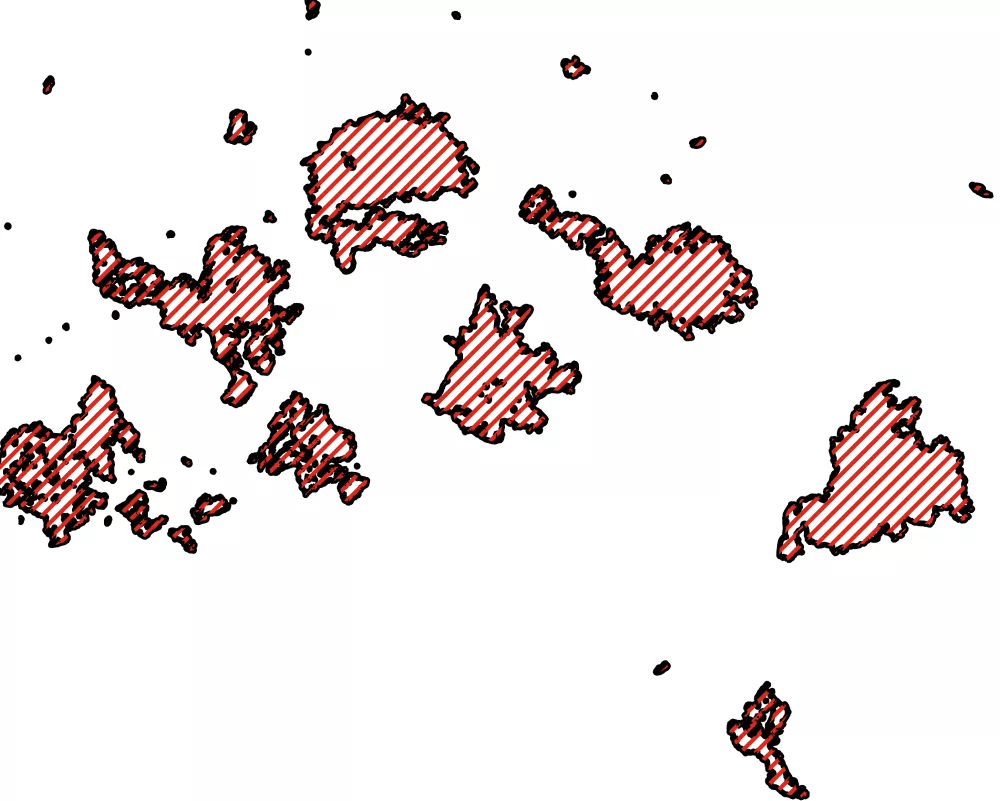
Damage Delineation (Burned Areas)
Extracted vector polygons delineating the exact boundaries of the active burn zones. These layers isolate high-destruction patches to cross-reference exactly where the fire breached security corridors.
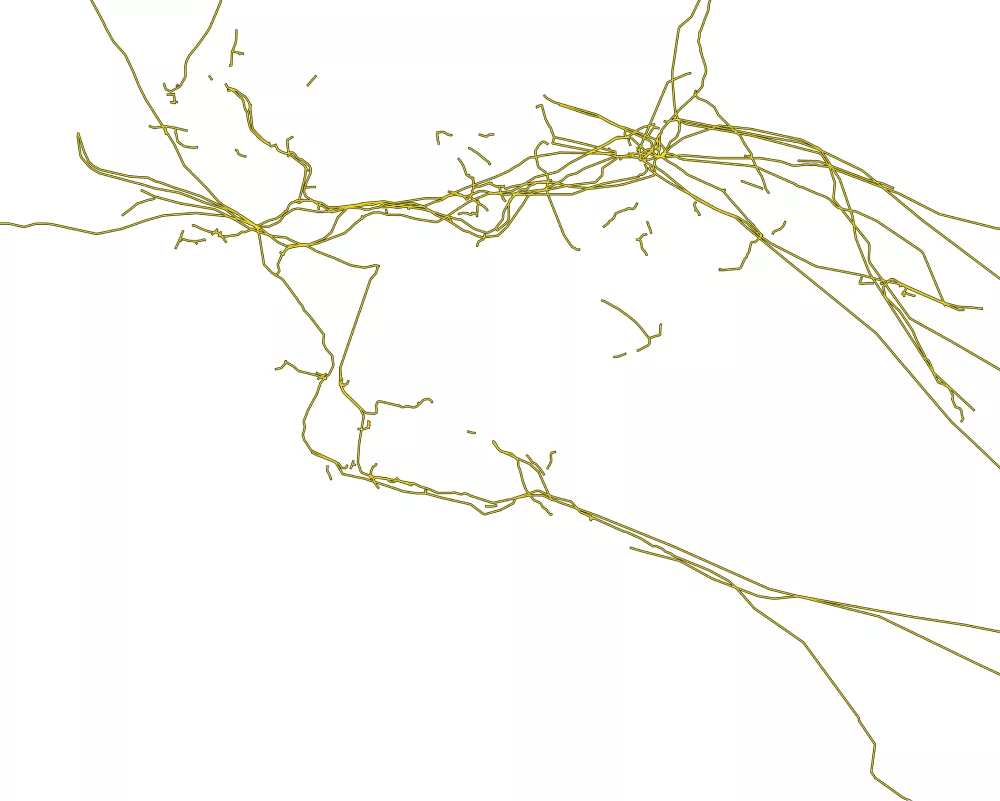
Critical Infrastructure Exposure (Power Lines)
Geospatial overlay of the regional 400 kV transmission lines grid. Mapping this directly against the post-fire scars reveals which towers and grid segments suffered heavy thermal stress or require structural maintenance.
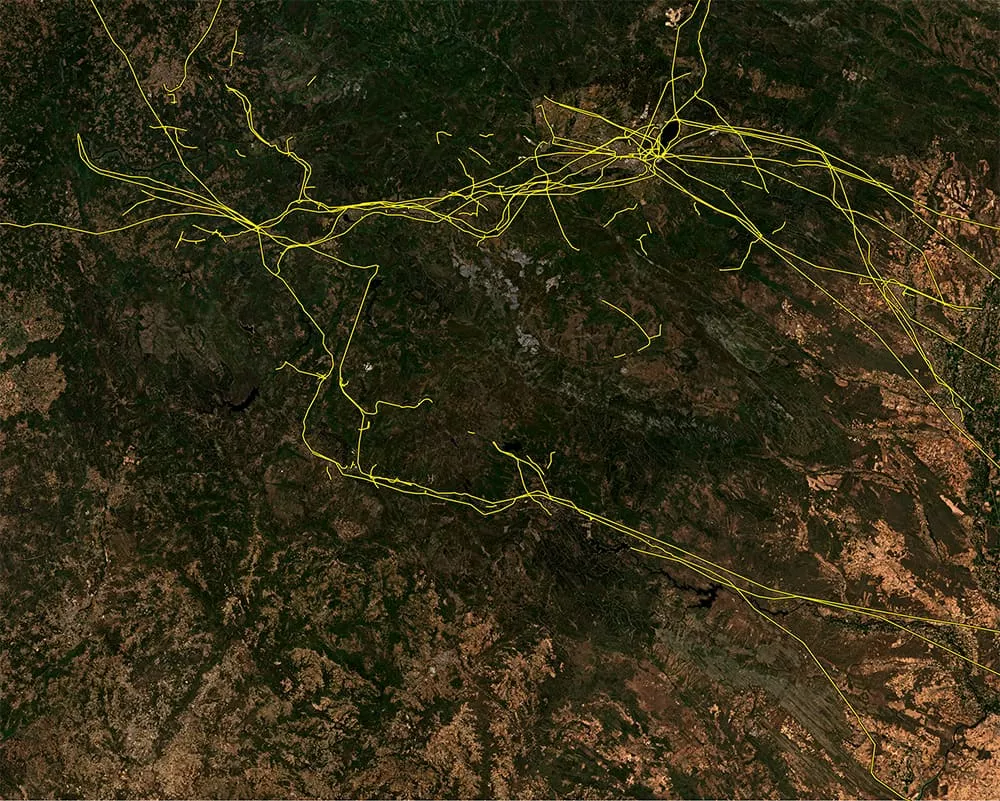
Pre-Fire Asset Context (Infrastructure Overlay)
Geospatial overlay of the strategic 400 kV regional transmission line network and key hydropower assets mapped directly onto the pre-fire Sentinel-2 summer median composite. Establishing this operational baseline allows asset managers to visualise the exact routing of critical corridors through heavily wooded, fire-prone fuel zones prior to environmental stress events.
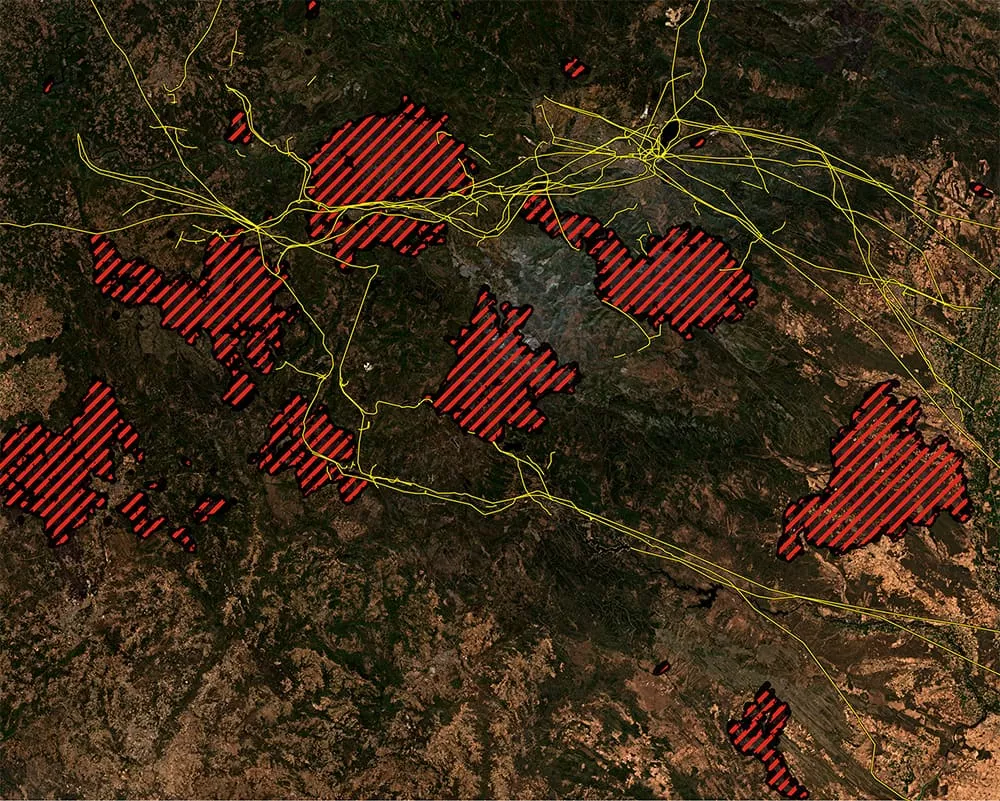
Integrated Exposure Synthesis (All Combined - Post-Fire)
The final multi-criteria mapping that integrates the post-fire visual scarring, the pre-fire environmental baseline, and the officially delineated burned area vectors. By overlaying the regional transmission line infrastructure onto the active burn scars, this combined output automatically exposes and highlights the exact grid segments and structural assets that faced direct fire contact or intense thermal stress during the event.
Power of Copernicus
The grid's long-term reliability depends on understanding the cumulative stress that repeated extreme events place on assets. By analysing multi-year Copernicus archives, TSOs can track each asset's exposure history and turn it into an objective Cumulative Exposure Score (CES). Take a 40 km transmission corridor in Andalucía. Between 2020 and 2025, Copernicus records three nearby fire events (EFFIS), severe drought on 42% of fire-season days, a 14% rise in woody biomass (CLMS), and persistent post-flood soil moisture anomalies (Sentinel-1). The composite CES reaches 0.78, high-risk, even though no single event has yet caused an outage. The score makes the cumulative argument explicit, rather than waiting for the next fire to prove it. It gives operators the evidence to prioritise reinforcements, justify spending to regulators, and plan replacements on quantified risk rather than reactive repair.
The score makes the cumulative argument explicit, rather than waiting for the next fire to reveal it. By this, operators and Earth observation service providers can develop simulations of how repeated inundation cycles or recurring wildfire proximity degrade structural integrity over time. These models can provide the technical evidence needed to prioritise reinforcements, justify capital expenditure to regulators, and inform long-term infrastructure replacement strategies based on quantified risk rather than reactive maintenance.
Powerlines at risk
This is an interactive dashboard. Click on the various segments to access detailed information.
Who benefits
from Copernicus?
Copernicus gives grid operators a consistent, auditable view of climate-driven physical risk across thousands of kilometres of transmission and distribution infrastructure. It supports a shift from reactive repair to proactive, evidence-based resilience planning.
By combining flood forecasts (EFAS, GloFAS), fire and drought indicators (EFFIS, EDO), vegetation and biomass layers (CLMS), and Sentinel-2 observations, operators can pinpoint the network segments where vulnerability is building, and act before assets fail.
Benefits for grid operators (TSOs and DSOs)
Anticipate flood, fire, and heat impacts on specific substations, corridors, and towers Prioritise vegetation management and structural reinforcement using objective risk indicators Direct maintenance budgets to the assets at greatest risk, not the most recent failures Justify capital expenditure to regulators with quantified, traceable evidence.
Benefits for Regulators
Understand risks at continent-scale, and strengthen the evidence base
for resilience funding and regulatory frameworks.
Explore this
further with us
Copernicus Sentinel data and many Copernicus service products are free and openly available, making it easier to scale monitoring across multiple sites and regions.
EUSPA can support stakeholders by helping identify fit-for-purpose Copernicus datasets, designing meaningful indicators, and connecting with EO service providers to operationalise dashboards, reporting and alerts.