Value chain monitoring of EU high-value agricultural commodities
- Insurance & finance
As global trade corridors expand, Europe’s high-value agricultural commodity exports face growing exposure to climate and quality-related uncertainty. Here is how Earth observation transforms fragmented market signals into actionable intelligence across the entire value chain.

€
-
billion
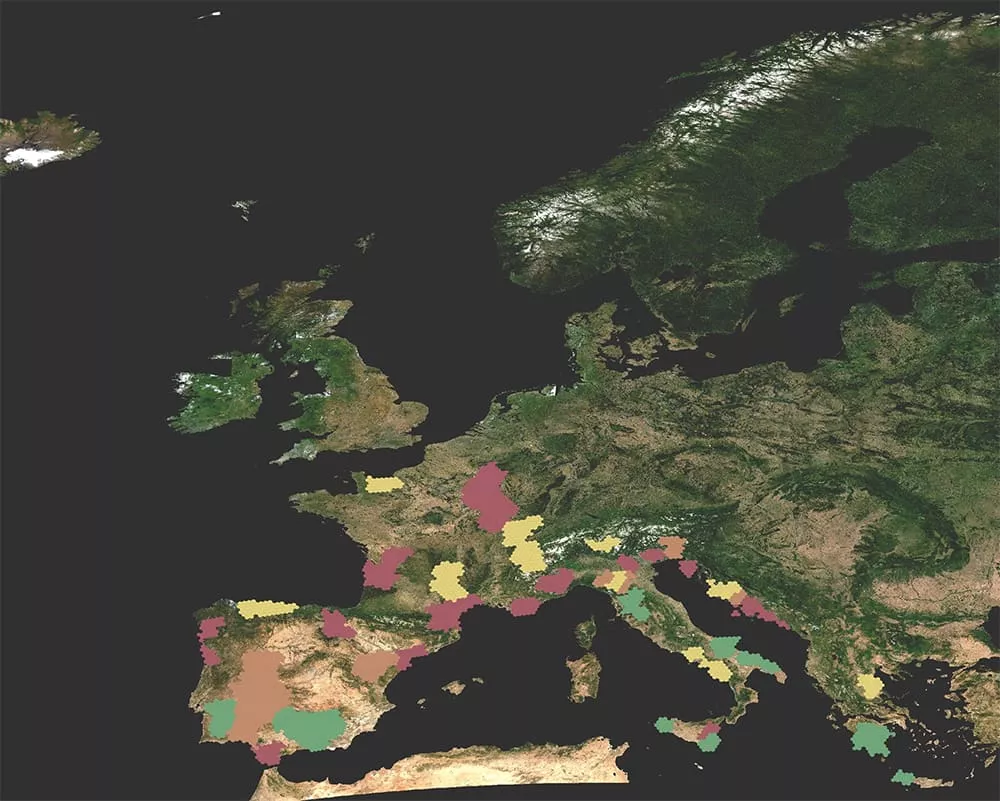
the annual sales value of EU Geographical Indication products — over a fifth of it generated by exports outside the EU.
Volatility of global commodity trade
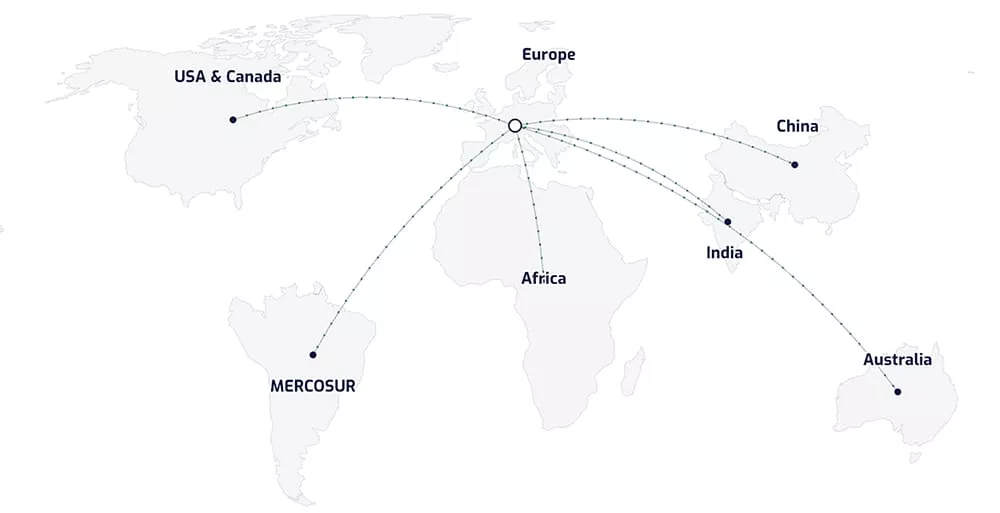
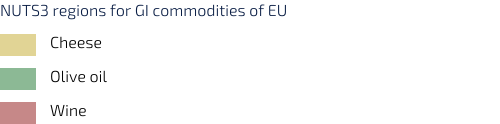
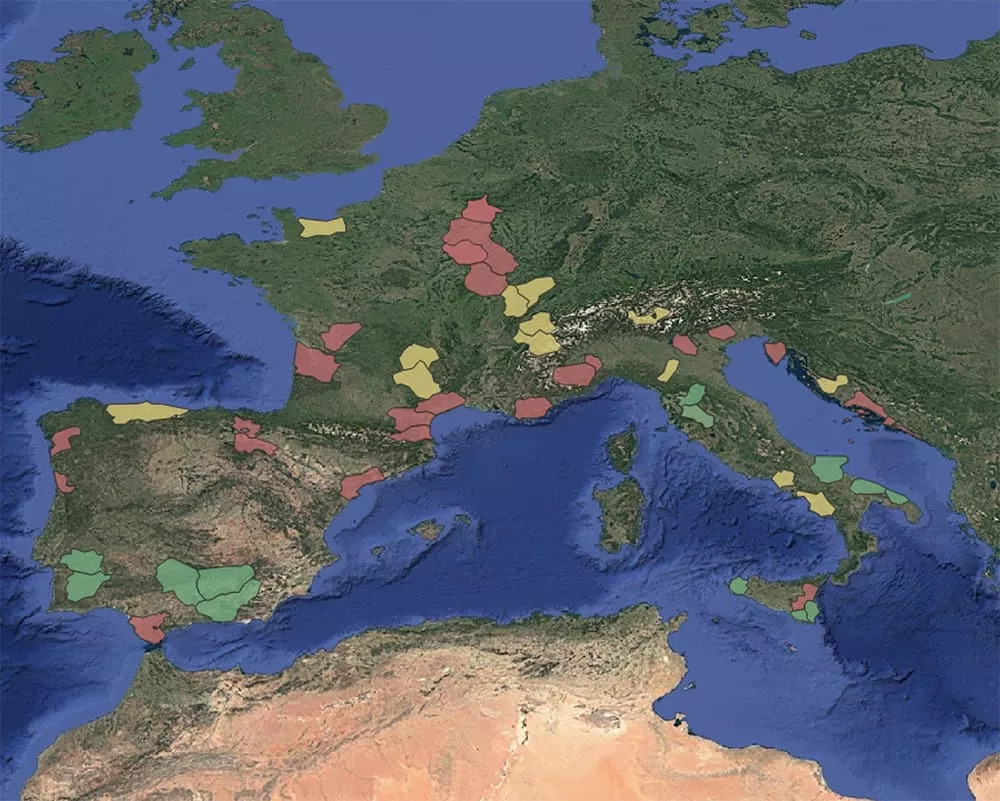
The signing and expected implementation of the EU’s trade agreements with India and Mercosur have shifted the scale of agricultural trade from regional to geopolitical. For supply-chain finance desks and institutional investors, these agreements represent a massive expansion of "Geographical Indication" (GI) exports of high-value commodities tied to specific European origins.
Volatility of global commodity trade
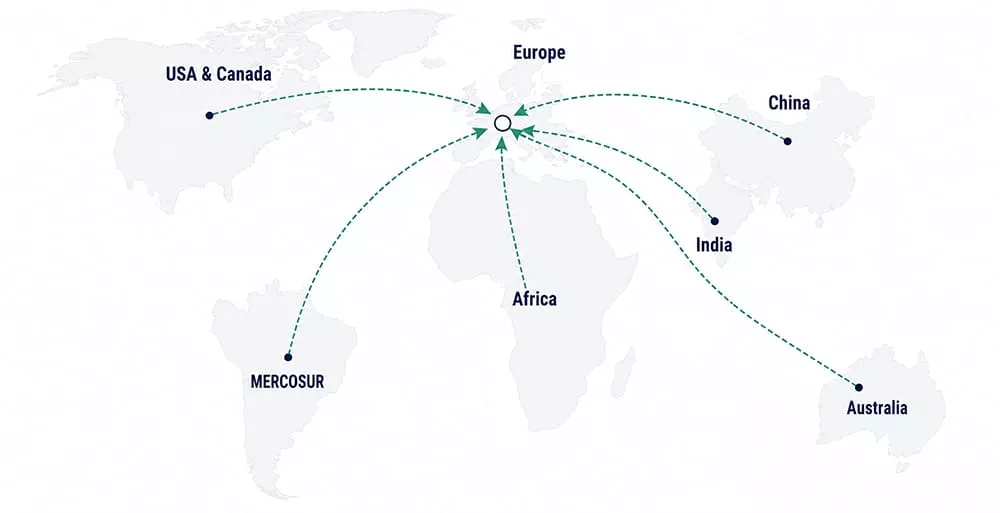
The exposure is not one-directional. Europe is also one of the world's largest importers of soybeans, coffee, cocoa and palm oil, so watching crop conditions in Brazil, West Africa and Southeast Asia gives an EU desk an early read on supply and price.
This expansion increases exposure to regional climate shocks. When the underlying value of a trade-finance facility is tied to the quality grade of a vintage, traditional market intelligence is no longer sufficient. To maintain a competitive edge in these new corridors, EU financial institutions require a sovereign source of information to protect working capital, optimise portfolio valuations, and ensure collateral liquidity against global price fluctuations.
Where Earth observation adds insight along the value chain
Crop and vegetation health is the focus here, but it is just one link in a wider chain that runs from production through storage and transport to trade.
The same approach extends to other commodity sectors, from mining products and aquaculture to timber and forestry.
The Information Gap
Historically, commodity analysts have relied on indicators such as harvest reports and fragmented industry feedback that describe the past rather than the future. For a bank managing an inventory-backed facility or an investment analyst valuing agricultural equities, this delay is a structural risk.
In quality-tiered sectors like wine or olive oil, a "volume-heavy" harvest can mask a "quality-poor" outcome. Without real-time, objective data, a bank may find itself over-leveraged against a commodity that has shifted from premium-grade to bulk-grade value.
This "Information Gap" leads to mispriced credit and inaccurate inventory haircuts, and delayed equity adjustments, leaving portfolios vulnerable to sudden market corrections.
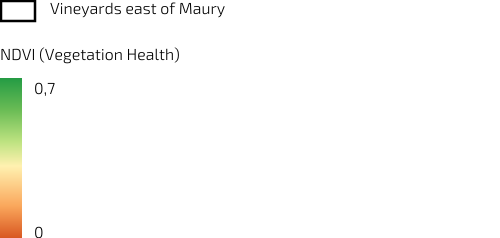
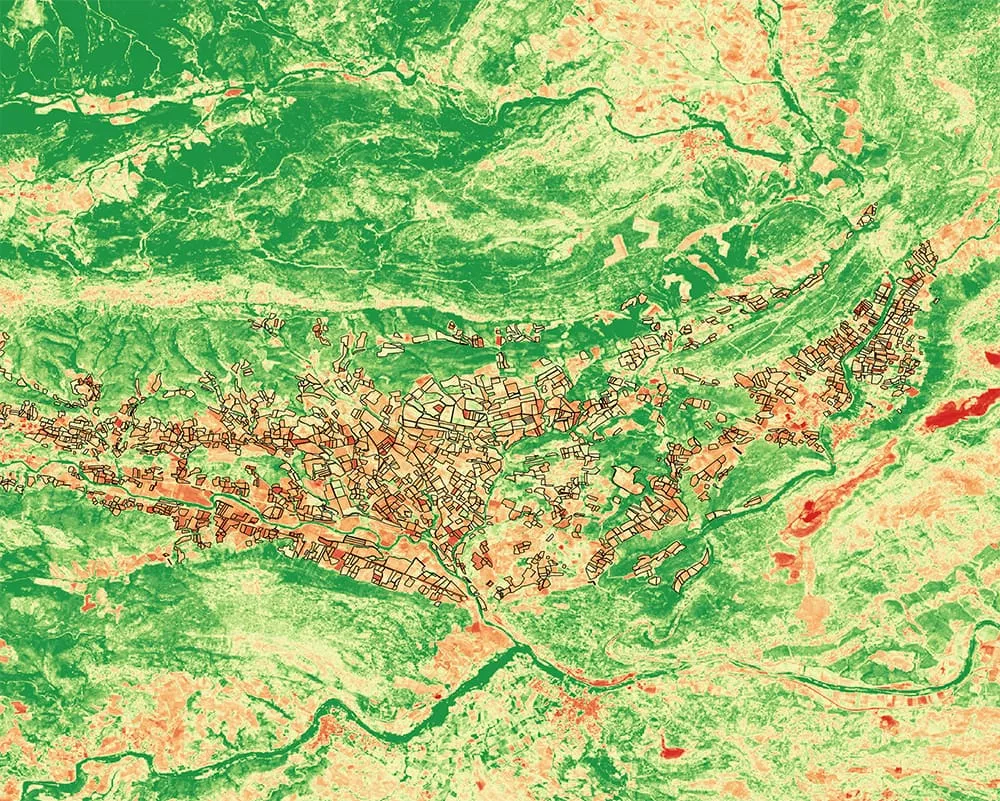
The image shows severe drought-induced vegetation stress across the region's historic vineyards, as seen by Sentinel-2. Drought affected the area during the critical ripening period for grapes and resulted in up to 50% reduction in the overall crop yield volumes. Copernicus provides insight into commodity availability long before it reaches the market. Languedoc-Roussillon, (France), August 2023
Real-Time Audit (CLMS)
The Copernicus Land Monitoring Service (CLMS) provides a permanent, objective audit of the biophysical assets underlying trade finance. Analysts can move beyond anecdotal evidence to monitor Canopy Density and Vegetation Vitality at a regional scale by utilising layers like:
- High Resolution Vegetation Phenology (HR-VPP),
- Fraction of Absorbed Photosynthetically Active Radiation (FAPAR),
- Net Primary Production (NPP)
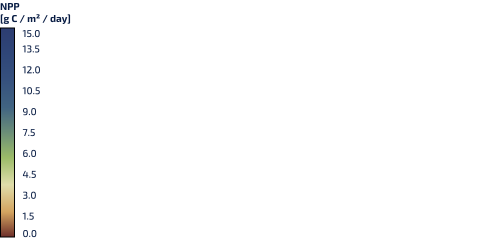
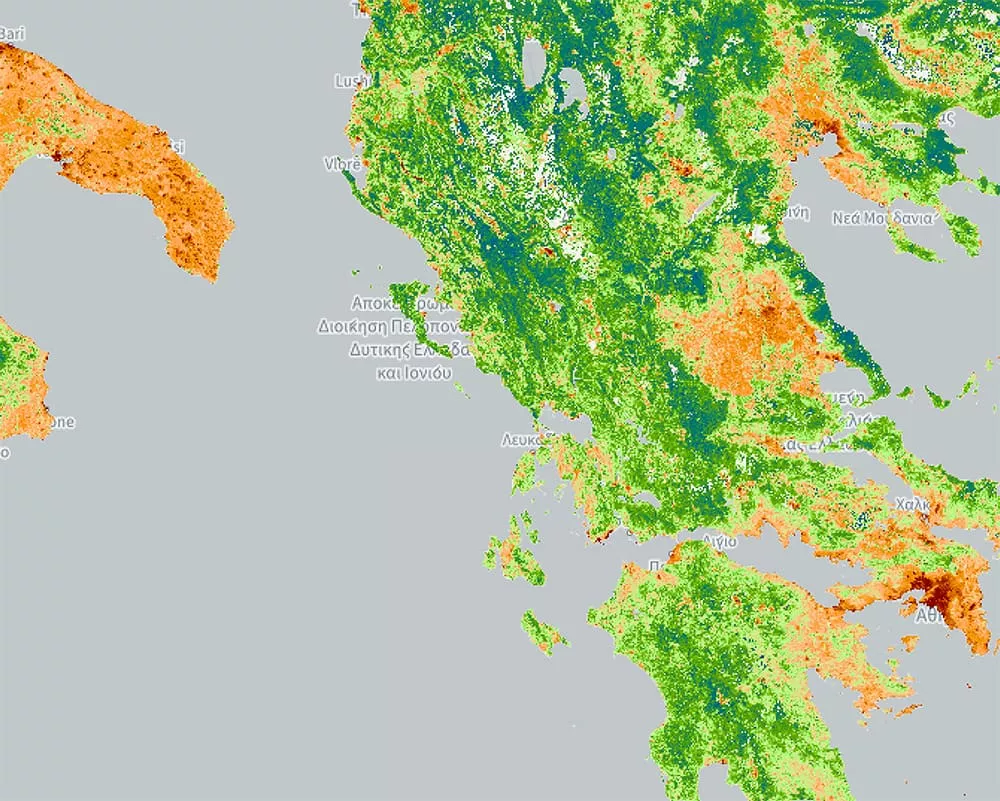
This image from the CLMS Data Viewer shows the Net Primary Productivity (NPP) over southern Italy and Greece, in grams of carbon fixed per square metre per day. Blue marks the most productive vegetation, red the least, separating vigorous groves and irrigated land from drought-stressed ground.
This is not "precision farming"; it is regional portfolio oversight. By tracking deviations from 10-year seasonal baselines across entire trade regions (e.g., the Douro or Bordeaux), analysts can identify yield compression and quality-grade shifts weeks before they impact the spot market or company earnings calls. This allows for the proactive adjustment of advance rates based on observed asset performance.
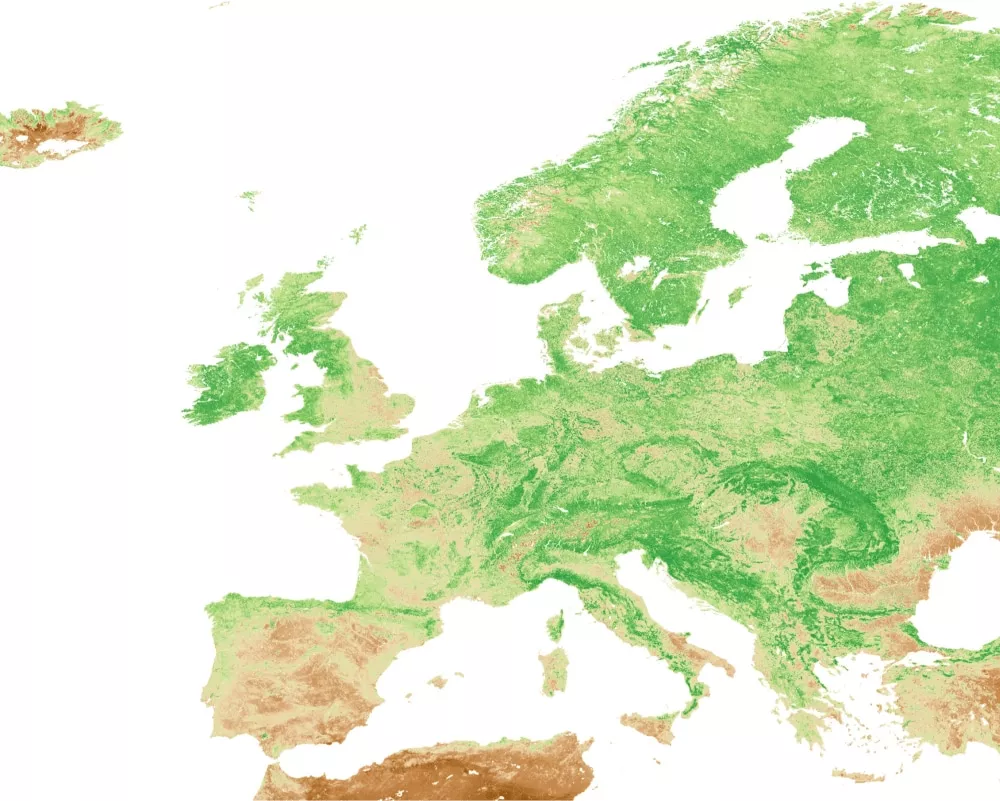
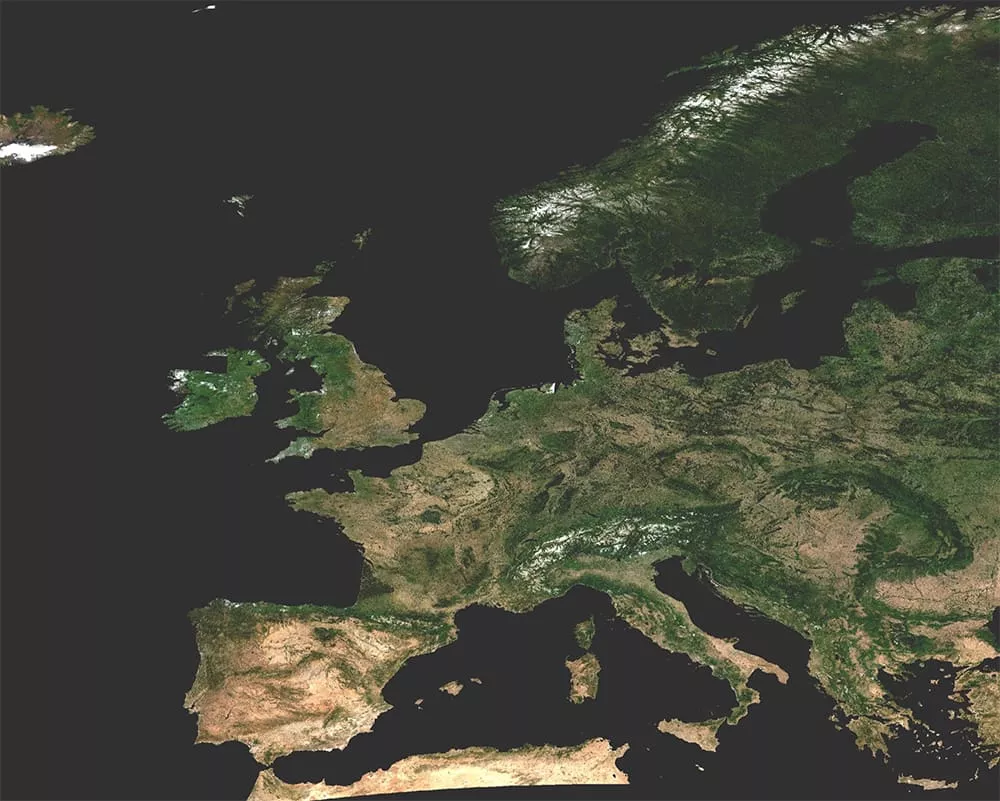
The map shows the value of FAPAR over Europe in August 2025.
At continental scale, FAPAR traces the rhythm of the growing season. In late summer, productivity stays high across central and northern Europe, while the drier Mediterranean shows much lower values.
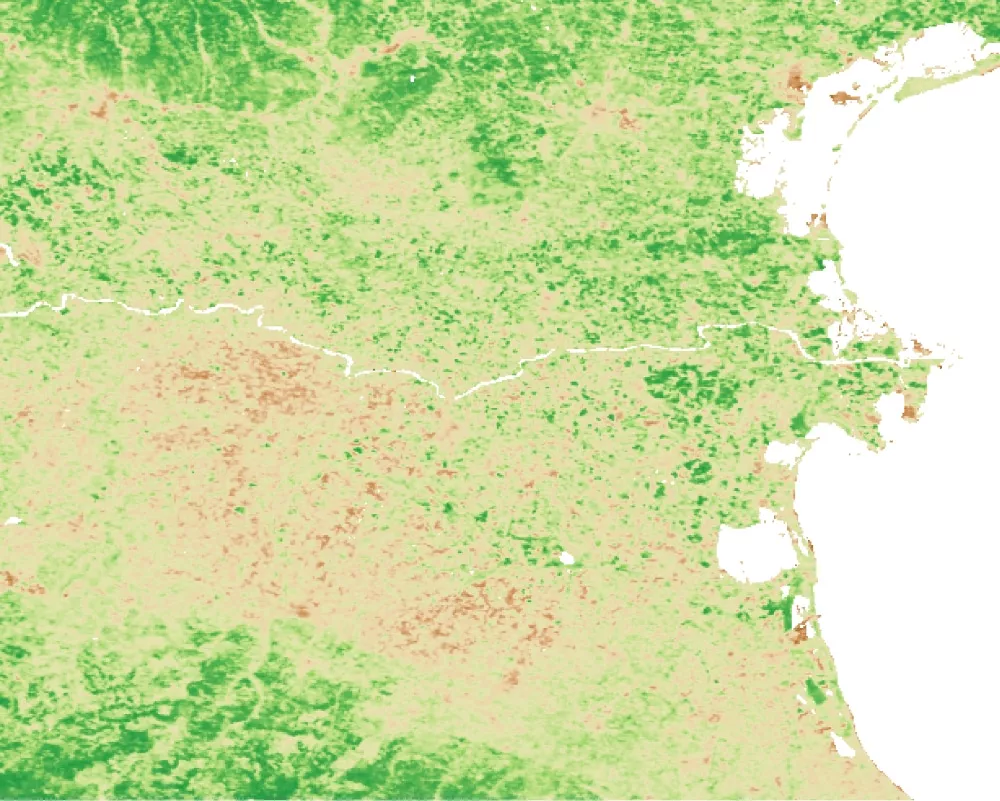
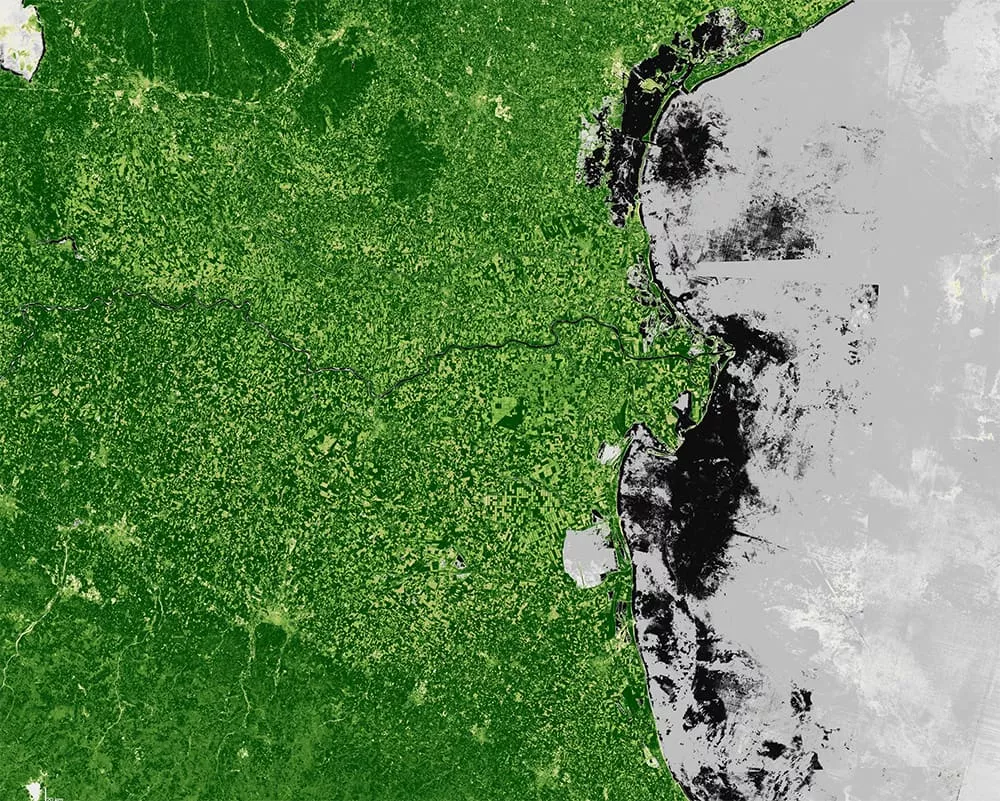
Zooming into the Po Delta (Italy) reveals more detail. We can see a patchwork of rice paddies, other crops, and natural wetlands, each absorbing light differently.
Monitoring this type of data is how seasonal stress is detected early, field by field, before it shows up in harvest figures.
The map shows the value of FAPAR over Europe in August 2025.
At continental scale, FAPAR traces the rhythm of the growing season. In late summer, productivity stays high across central and northern Europe, while the drier Mediterranean shows much lower values.
Canopy density gives a better understanding of biomass than greenness alone.
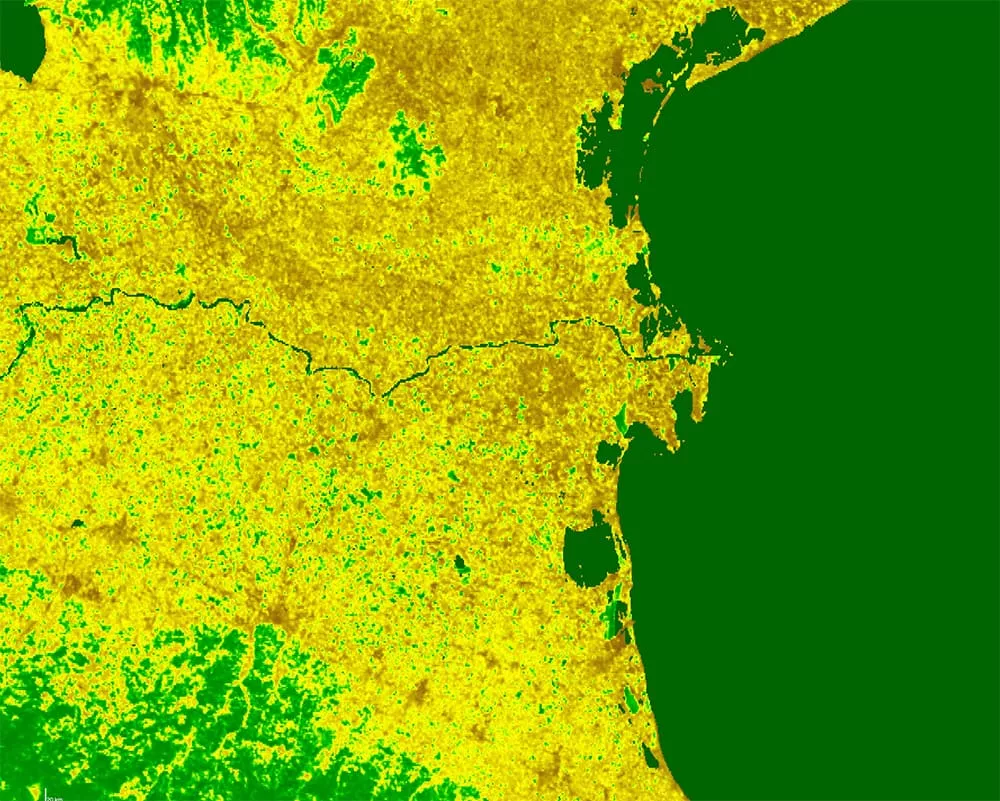
Vegetation productivity for the Po Delta, an important Italian GI region for rice production. Source: CLMS
Source: Copernicus CLMS
Graph shows the 10-year dynamics of the FAPAR parameter, an important indicator of vegetation productivity.
Two things to note are:
- The productivity in 2022 was lower than before or after.
- From 2022 onwards, you can see drops in the middle of every vegetation season.
In 2022, the Po Valley was hit by its worst drought in over two centuries, with a prolonged heatwave and months without rain severely affecting agriculture across the region.
Role of Sentinels
Operational crop monitoring never rests on a single number. It combines optical, radar and meteorological data, so that cloud cover, a growth stage or one sensor's blind spot never breaks the read. Copernicus brings these layers together into one view of crop health, biomass, water stress, expected yield and production risk. FAPAR and other CLMS vegetation data products give us important information, but are only part of the story, and are read next to the Normalised Difference Vegetation Index (NDVI)' Synthetic Aperture Radar (SAR) backscatter and other derivatives of data available from the Sentinel missions.
Sentinel-2 NDVI over the Po Delta: greenness as a proxy for vegetation vigour, with the rice paddies standing out against bare soil and open water.
With these layers combined, Copernicus gives financial institutions an early read on future supply of high-value agricultural commodities, before it moves the market.
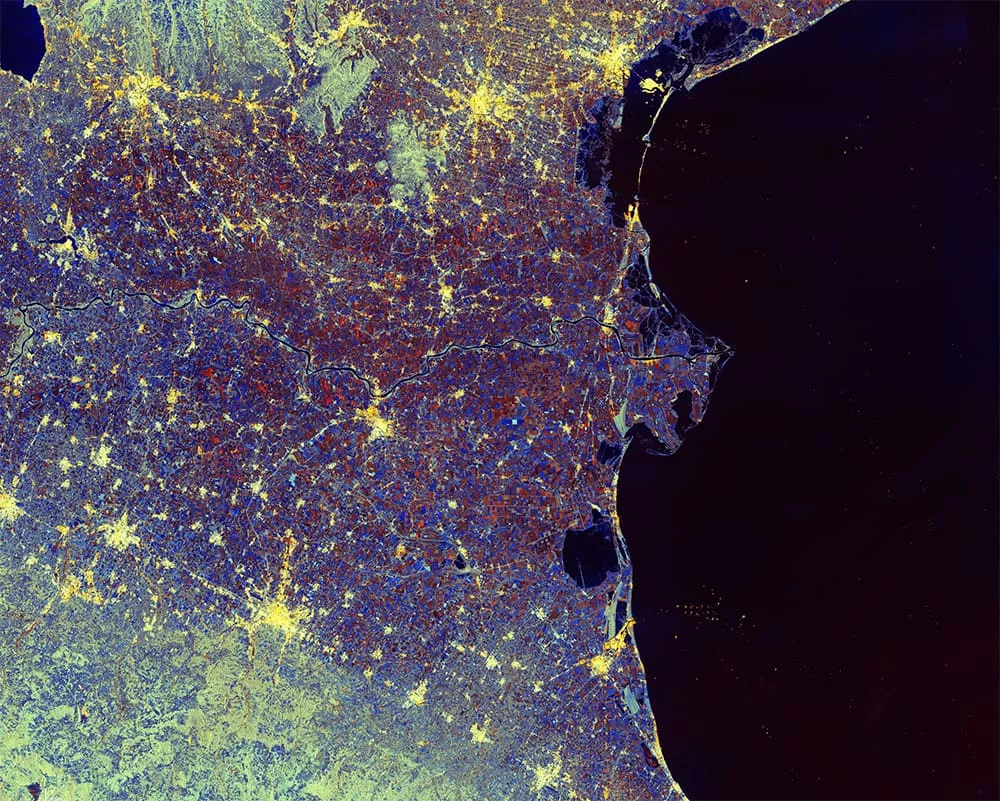
Sentinel-1 GRD backscatter data sees through cloud, picking out crop structure and surface moisture when the optical view is blocked.
The Climate Context (C3S)
Observation of current stress is only actionable when placed in a predictive context. The Copernicus Climate Change Service (C3S) delivers the historical reanalysis and forward-looking seasonal outlooks required to model future supply tightness.
By integrating precipitation anomalies and heat-stress projections, commodity analysts can determine if a ripening window disruption is likely to occur. This allows financial institutions to move from "What is happening?" to "What is the probability of a quality downgrade?"
C3S provides the evidence base for climate due diligence, necessary to anticipate price formation and long-term asset viability across the India and Mercosur trade corridors.
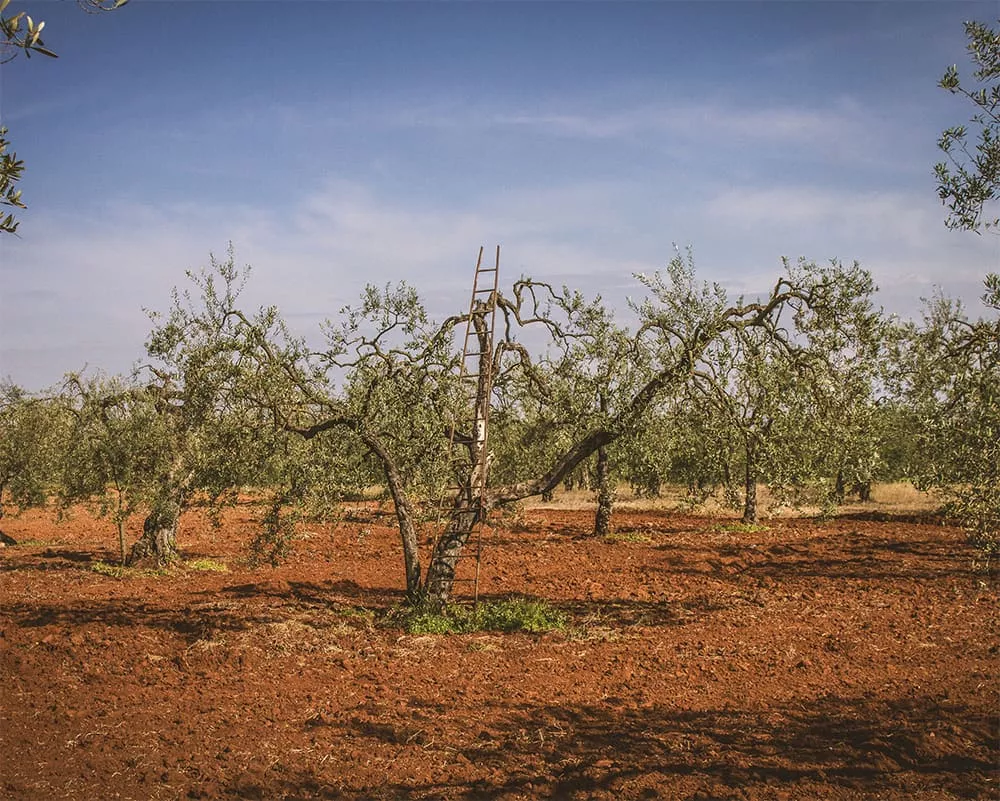
In a Mediterranean olive regions like Messinia, Copernicus vegetation and climate data layers give us the insight into current seasonal conditions and enable annual predictions. Set against the longer trend, when for example repeated dry springs pull the baseline itself downward, the shortfall can be seen as structural rather than a one-off. Current status and past trend only go so far.
To know whether the stress will continue it the next season, the analysis has to look forward, and that is where the Copernicus Climate Change Service comes in. Its climate projection outlook points to continued heat through the ripening window, turning a likely yield shortfall into a quantifiable probability of a quality downgrade. A trade-finance desk can raise the haircut on the affected collateral now. An asset manager can move a position on the exposed agribusiness equity.
A lender can re-rate the borrower's repayment capacity. Official statistics confirm it weeks later, by which point the institution has already acted on the evidence, ahead of the spot market.
Climate projections (2027–2032)
Seasonal precipitation & air temperature — Messinia olive region (C3S)
Graph shows the climate projections for Messinia: hot, dry summers with most rain in the cooler months. The winters of 2028 to 2030 are warmer and drier than the years around them, which can start the growing season early and leave less water in the ground. Add summer dry spells and those years point to weaker olive harvests and less oil. For a bank or investor, that is an early warning: the seasons to price for higher risk, adjust collateral, and act before the harvest figures arrive.
Source: Copernicus C3S
Potential of Copernicus Data Integration
The strength of Copernicus is how its parts combine: Sentinel optical and radar data field by field, the Land and Climate services for the wider and forward view. Together they reveal where the supply and quality of high-value commodities is heading, down to a single vineyard or olive grove.
This dashboard provides vintage quality outlook for the Croatian wine regions in Dalmatia. (C3S seasonal outlook + CLMS indicators.)
A modelled, illustrative view of how the region's grape quality may shift with the climate. Building on Copernicus climate projections and peer-reviewed studies on how each variety responds to heat and drought, tools like this can flag where quality risk is rising and roughly when, early enough to inform financing and trading decisions.
This is an interactive dashboard. Click on the various cities to access detailed information.
Sentinel-2 False Colour image (NIR*-Red-Green) of southern part of the Dalmatian region - Croatia. This region is an important hub for exports of high-value commodities like vine and olive oil.
As it is sensitive to chlorophyll content, this combination of bands is frequently used for high level of visual analysis of biophysical parameters that shape the quality and quantitiy of high-value agricultural commodities
*Near-infrared (NIR): the band just beyond visible red, captured by Sentinel-2 in Band 8; healthy vegetation reflects it strongly, so the brighter the NIR, the more vigorous the canopy, which makes it the key band for reading plant health.
Turning Environmental Intelligence into Financial Advantage
This approach ensures that EU banks, asset managers and investors remain the most informed actors in the global commodity market, turning environmental data into a measurable financial advantage.

Pricing the Unpriceable
As climate volatility becomes a permanent feature of global trade, the "anecdotal approach" to commodity analysis is no longer viable. The Copernicus programme offers a Sovereign, High-Precision Data Stream that allows the European financial sector to "price the unpriceable." By adopting these services, EU financial institutions are not just monitoring crops — they are building a sovereign and resilient, data-driven financial and trade infrastructure.
Bottom Line for Finance
The integration of Copernicus data and services enables a transition from reactive reporting to proactive risk management. By converting biophysical signals into "Supply-Tightness Signals," banks and investors can optimise their financial decision-making:
- Dynamic collateral valuation: adjust inventory haircuts as quality-grade risks emerge, keeping each loan matched to what the stock is actually worth. A bank lending against a vintage that has slipped from premium to bulk grade learns it in-season, not at the write-down, which protects working capital and avoids forced losses when the market reprices.
- Credit Pricing: Aligning trade-finance interest rates with the evolving risk profile of the specific trade corridor. This means that lending rates are set against the real risk of each region, so dependable sources are not charged too much and struggling ones are not charged too little.
- Equity & Asset Valuation: Anticipating regional supply shocks to adjust 'Buy/Sell' positions before production downgrades are priced into the market. This helps the financial sector catch regional supply trouble early and decide whether to buy or sell before it shows up in prices. Moving ahead of the market turns a shock into a gain instead of a loss.
Who benefits
from Copernicus?
Copernicus turns biophysical signals from Europe's production regions into objective, real-time supply-tightness intelligence — giving financial actors a sovereign edge over anecdotal harvest reports.
For banks & trade-finance desks
• Adjust inventory haircuts and advance rates in real time as quality-grade risks emerge
• Price trade-finance facilities against the live risk profile of each corridor
• Protect working capital and collateral liquidity across the India and Mercosur routes
For asset managers & investors
• Anticipate regional supply shocks before downgrades are priced into the market
• Strengthen climate due diligence and long-term asset-viability assessments
• Adjust Buy/Sell positions on agricultural equities with objective, forward-looking evidence
Explore this
further with us
Copernicus Sentinel data and many Copernicus service products are free and openly available, making it easier to scale monitoring across multiple sites and regions.
EUSPA can support stakeholders by helping identify fit-for-purpose Copernicus datasets, designing meaningful indicators, and connecting with EO service providers to operationalise dashboards, reporting and alerts.