Urban CO₂ emissions
- Urban development
Cities are under pressure to reduce CO₂ emissions while improving climate resilience.
For climate officers and urban planners, a key challenge is understanding where emissions are concentrated, how they change over time, and where urban vegetation can help offset part of the impact.
Cities produce
-
% of GHG emissions
CO₂ is the main GHG

Urban CO2 emissions and uptake
Cities are responsible for a large share of global CO₂ emissions, driven by traffic, buildings, energy use, human activity, and the balance between emissions and biogenic uptake. They are also expected to report progress towards climate-neutrality commitments, for example under the EU Mission for Climate-Neutral and Smart Cities.
Inventories are essential for reporting, but they often provide aggregated totals rather than spatially detailed evidence for action. CO2 emission modelling could help close this gap by showing where emissions occur, how they change over time, and where urban vegetation can better support CO₂ uptake.
Real city needs (Zaragoza )
Zaragoza is a city with an unusually large and diverse municipal territory, combining dense urban areas, industrial activity and non-urban land uses. CO₂ modelling could help the city see how emissions vary across these different areas, making it easier to understand where pressures are highest and where action may be most effective. For example, spatial CO₂ maps could support discussions on industrial zones, mobility corridors and peri-urban land management, while helping municipal teams connect climate information with existing planning and environmental systems.
Real city needs (Thessaloniki)
The Thessaloniki urban area spans multiple municipalities, but the Climate City Contract under the EU Cities Mission applies to the central municipality. CO₂ emissions, however, are linked to the wider urban area, not just the city centre. CO₂ modelling could help the city see where emissions are generated and how they relate to the areas covered by its climate commitments. This would support more realistic planning, clearer reporting, and better coordination with neighbouring municipalities and sectors that influence the city’s emissions.
Urban CO2 emissions and uptake
City authorities need more than citywide CO₂ totals. They need spatially detailed evidence to prioritise mitigation measures, report progress under climate-neutrality commitments, and explain investment choices to policymakers, stakeholders and citizens.
Urban planners use the same evidence to turn climate goals into place-based decisions: where to retrofit buildings, redesign mobility, expand green infrastructure, or test new planning scenarios.
Without spatial detail, climate action risks staying too generic. A city may meet an overall reduction target while specific neighbourhoods, corridors or sectors continue to drive emissions — or while opportunities for CO₂ uptake remain invisible.
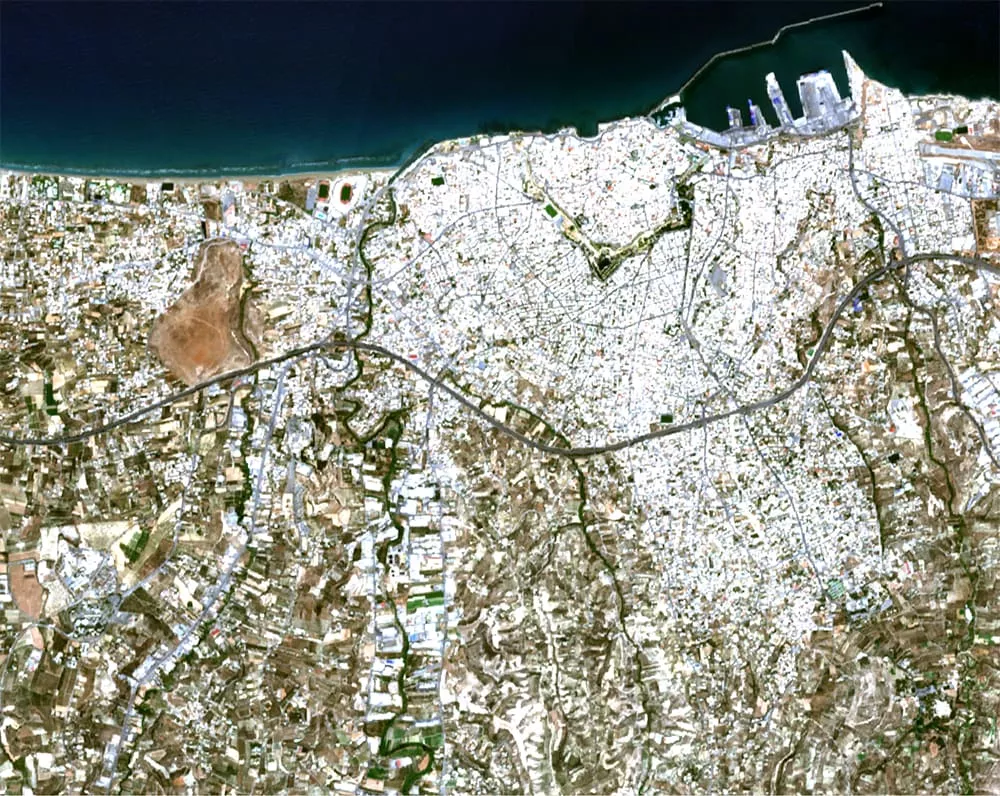
Copernicus Maps supporting CO2 modelling
Copernicus EO data may not directly give access to CO2 emission information, but they support the modelling required to produce high-resolution CO2 emission maps.
Land Use and Land Cover information from Sentinel-2 and CLMS are combined with high resolution building and tree information and traffic data to model Scope 1 CO2 emissions and uptake.
These maps are rigorously validated with in-situ local measurements to ensure robustness and accuracy.
In the storymap, daily CO2 emission averages for each season are demonstrated. However CO2 modelling can produce results with even hourly frequency.
The city of Heraklion, Greece

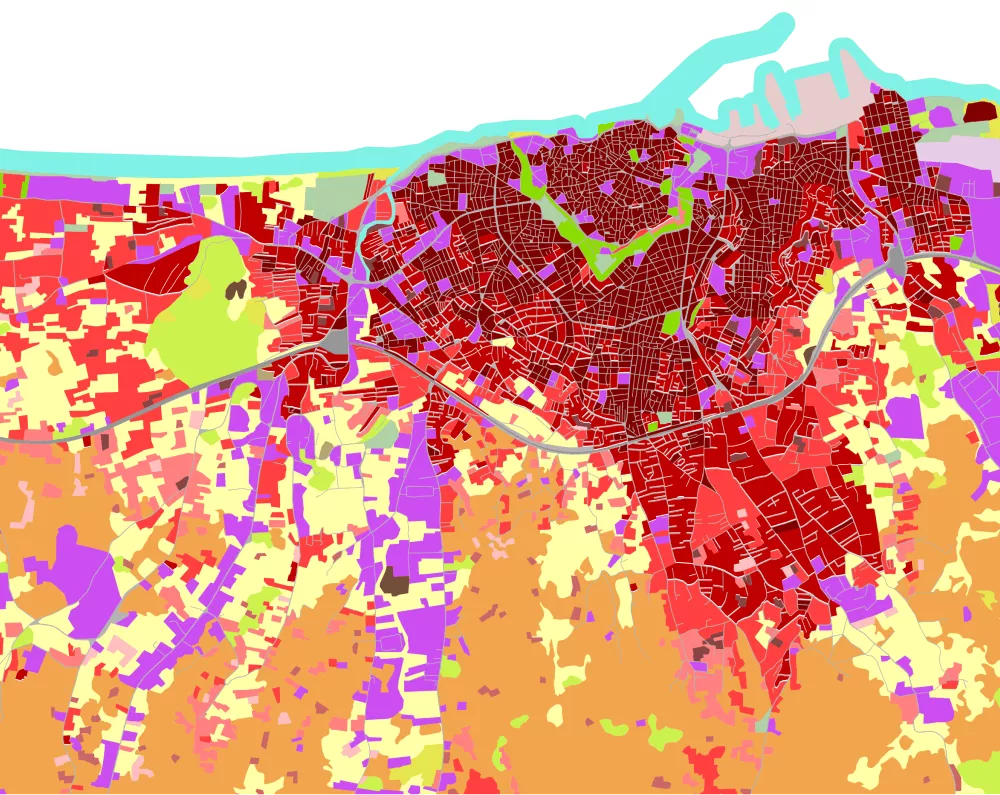

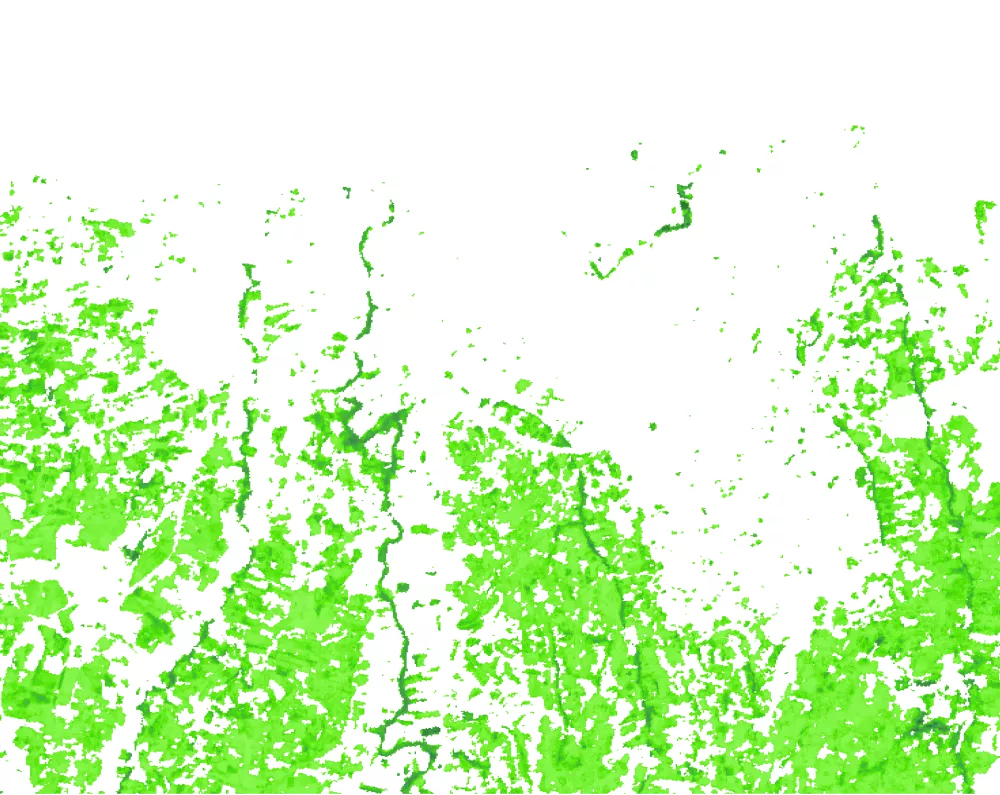

Sector emissions
Because the modelling chain integrates land cover, urban morphology, and activity data, CO₂ patterns can be interpreted in relation to how the city is built and used.
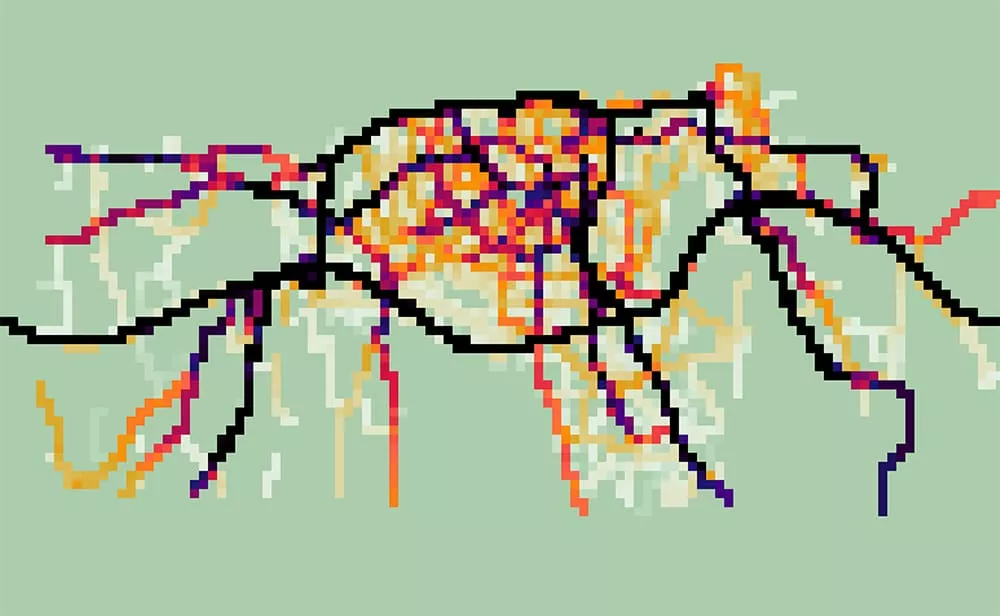
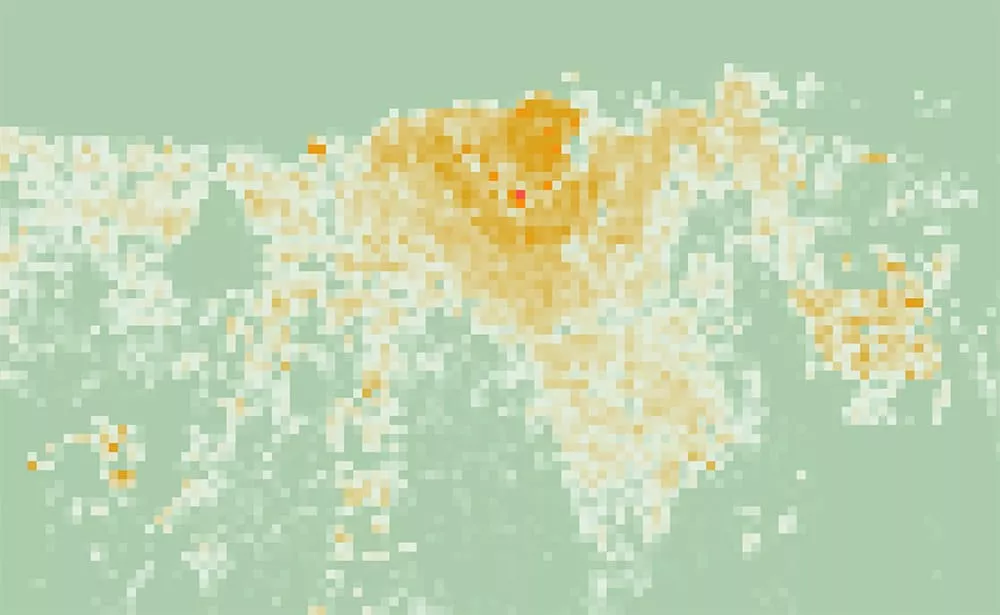
For example, the emissions from traffic are estimated separately from the anthropogenic emissions and the biogenic uptake. The CO₂ contribution from all the different sectors is summed to come up with the total CO₂ flux.
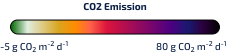
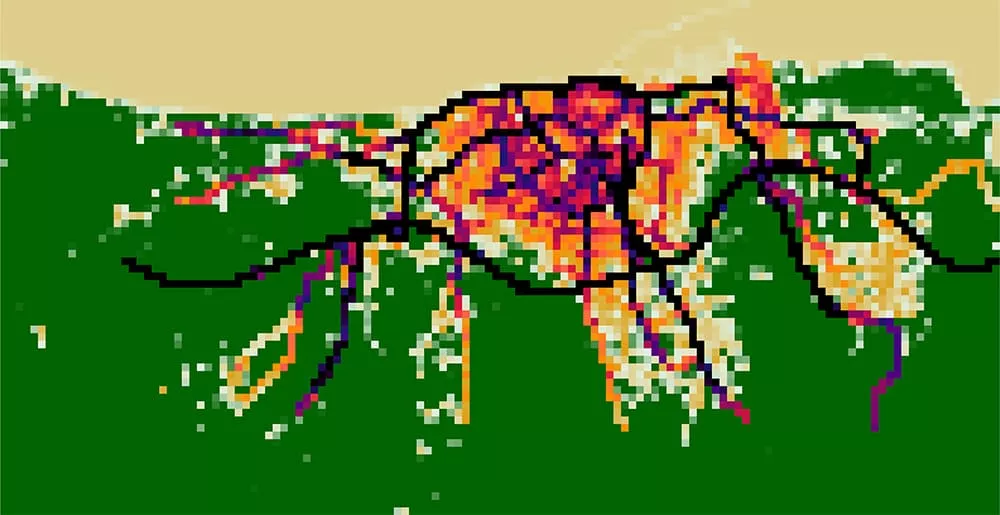
You can see on these CO₂ flux maps, traffic mostly contributes emissions along main roads, while vegetation absorbs CO₂.


Change over time
A single map provides only a snapshot in time, while CO₂ emissions vary significantly throughout the day and across seasons. Comparing winter and summer conditions, weekday and weekend patterns, and sector-specific emission layers helps stakeholders identify persistent hotspots, seasonal peaks, and areas where mitigation measures or nature-based solutions could have the greatest impact.
Importantly, modelling is capable of producing far more than representative daily averages. Results can be generated at hourly intervals, capturing CO₂ dynamics that change throughout the day because of traffic peaks, heating cycles, human activity patterns, and short-term meteorological conditions.
This temporal perspective can make annual CO₂ information more useful by showing what creates the yearly pattern. Emissions and uptake do not happen evenly throughout the year: heating demand can drive winter peaks, mobility can increase weekday emissions, and vegetation uptake is strongest during the growing season. For example, one neighbourhood may appear as a CO₂ hotspot mainly because winter heating and weekday mobility overlap, while another may remain under pressure across several seasons. This distinction helps municipalities see whether action should focus on reducing emissions at the source, strengthening uptake where this is feasible, or combining both approaches.
(winter, weekday)
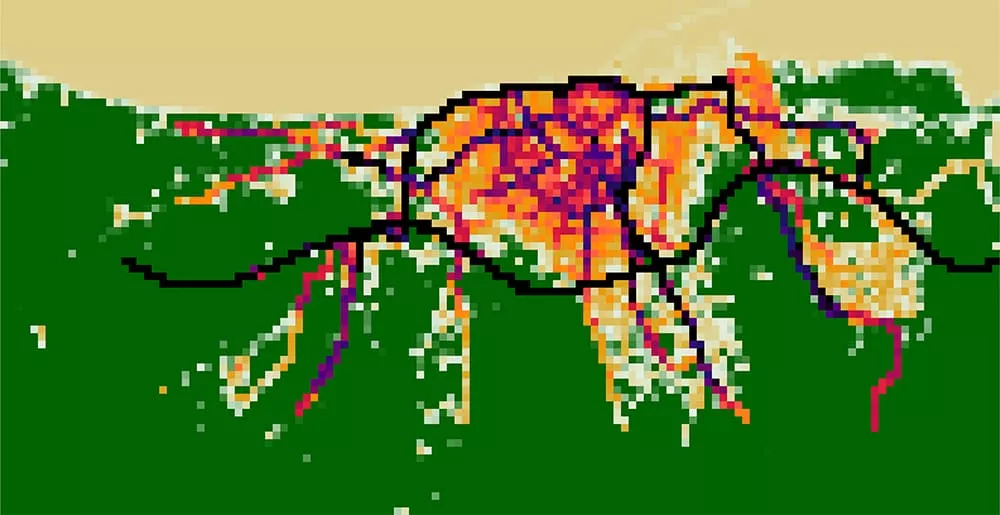
(winter, weekend)

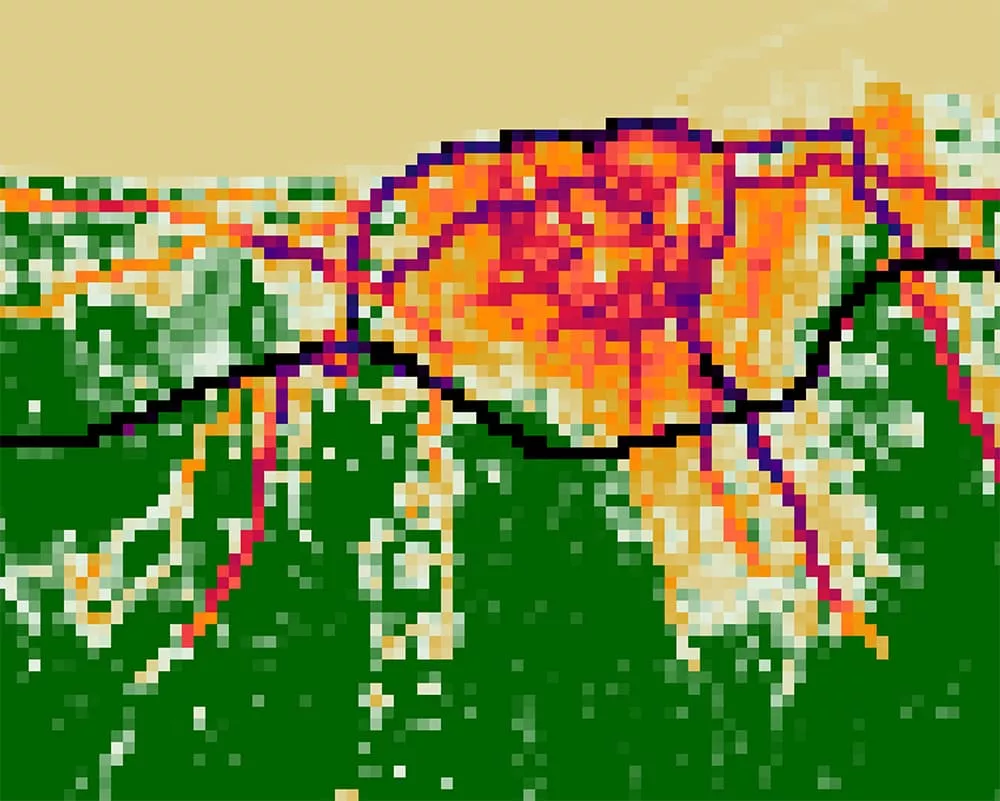
Weekday emissions are often higher than weekends due to commuter traffic and increased human activity.
Buildings emit more CO₂ during winter due to heating demand.
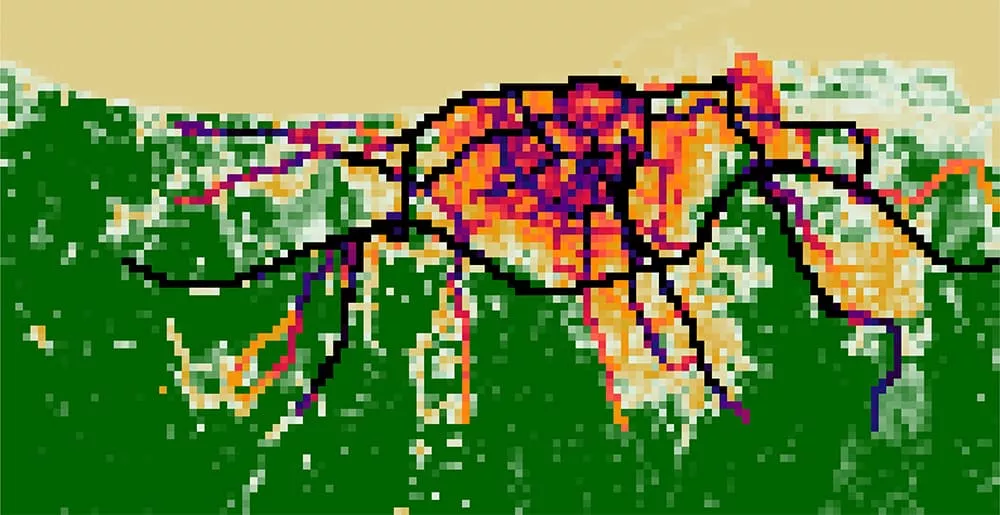
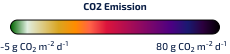
Different kinds of vegetation contribute differently across seasons. In Heraklion, vegetation dries in the summer, leading to decreased uptake.

Understanding the Limits
Street-scale CO₂ modelling provides valuable spatial insight into how emissions and carbon sequestration vary across the city, helping identify patterns and potential intervention areas that are difficult to capture through city-wide inventories alone.
As with any greenhouse gas estimate, including official inventories, results depend on the quality of input data, assumptions, and reporting boundaries. For street-scale modelling, important factors include traffic and mobility data availability, land-cover classification, building energy-use proxies, vegetation type, soil conditions, and local management practices.
For this reason, Copernicus-based CO₂ modelling should be seen as a complementary decision-support layer rather than a replacement for official greenhouse gas accounting or on-the-ground measurements. Used alongside existing monitoring frameworks, it can add spatial detail, support more targeted local action, and strengthen transparent, evidence-based climate planning.
Who benefits
from Copernicus?
Copernicus does not directly provide urban CO₂ emission maps, but it supports the modelling pipeline by supplying essential baseline datasets (such as land cover, atmospheric variables, and activity proxies) and satellite observations that enable refinement and spatial disaggregation of emissions. In this way, it allows static inventories to be transformed into dynamic, spatially explicit representations of urban carbon emissions.
City authorities can use Copernicus-based CO₂ modelling to gain a more spatially detailed understanding of emissions and carbon sequestration across the urban environment. This can support climate action planning, help identify priority intervention areas, and complement existing greenhouse gas inventories with consistent, regularly updated spatial information.
Urban planners can benefit from the ability to assess how land-use, green infrastructure and urban form influence local carbon dynamics at neighbourhood scale. The approach can support more climate-aware planning decisions and “what-if” scenario analysis, helping evaluate how interventions such as tree planting, green corridors or land-use changes may influence future emissions and carbon sequestration patterns before implementation.
Explore this
further with us
Copernicus data that support CO2 emission modelling are free and openly available, making them suitable for scaling analysis across multiple cities and regions.
EUSPA can support stakeholders in identifying appropriate Copernicus datasets and connecting with EO service providers to turn maps into operational tools for climate planning and reporting.