Climate risk vulnerability assessment
- Insurance & finance
From January 2026, European banks must factor climate risk into the same decisions they make about lending and capital. The new rules from the European Banking Authority focused on risks in the Evnironmantal Social and Governance domains, as well as the major EU-wide stress test in 2027 will test how well banks can measure that risk across their portfolios.
Copernicus, the EU's Earth observation programme, and its Climate Change Service (C3S) provide the data and forward-looking projections needed to meet those expectations.
Up to €
-
billion
Potential banking-sector losses under the severe combined scenario of the EU's 2024 Fit-for-55 climate scenario analysis (2023 to 2030 horizon).
The New Regulatory Paradigm
Europe's banking rules have moved from disclosure to action. The EBA Guidelines on managing ESG risks, effective from 11 January 2026, require banks to factor climate into how they lend, how they set strategy and how they hold capital against losses. Disclosure rules now demand evidence, at the level of individual borrowers, of physical and transition risk exposures, including where collateral behind the largest loans sits on the map.
For bank risk officers and ESG teams, this means a shift from policy statement to actual quantitative input.
Decisions on which risks matter, which loans to approve and how to score portfolios need to be backed by asset-level evidence, with forward-looking scenarios behind the numbers.
Acknowledging climate change is no longer enough. Banks have to measure it, price it, and defend the methodology towards in front the supervisory authorities
The 2027 EU-wide stress test will be the first major exercise after the EBA Guidelines come fully into force. It is when banks have to show how their climate risk frameworks actually perform under supervisor pressure, not in isolated thematic tests as before.
The exercise will test transition and physical risk, against asset-level evidence rather than sector averages, and over horizons that stretch decades beyond the usual three-year window. Results will shape supervisory activity and capital expectations where gaps are detected. Agricultural drought is one of the clearest examples: it now affects European regions that were not historically considered drought-prone, putting agricultural lending, water-dependent industrial collateral and inland real estate under stress that traditional risk models do not capture.
The question for risk teams is whether their existing data and models can deliver that level of resolution, or whether new inputs are needed.

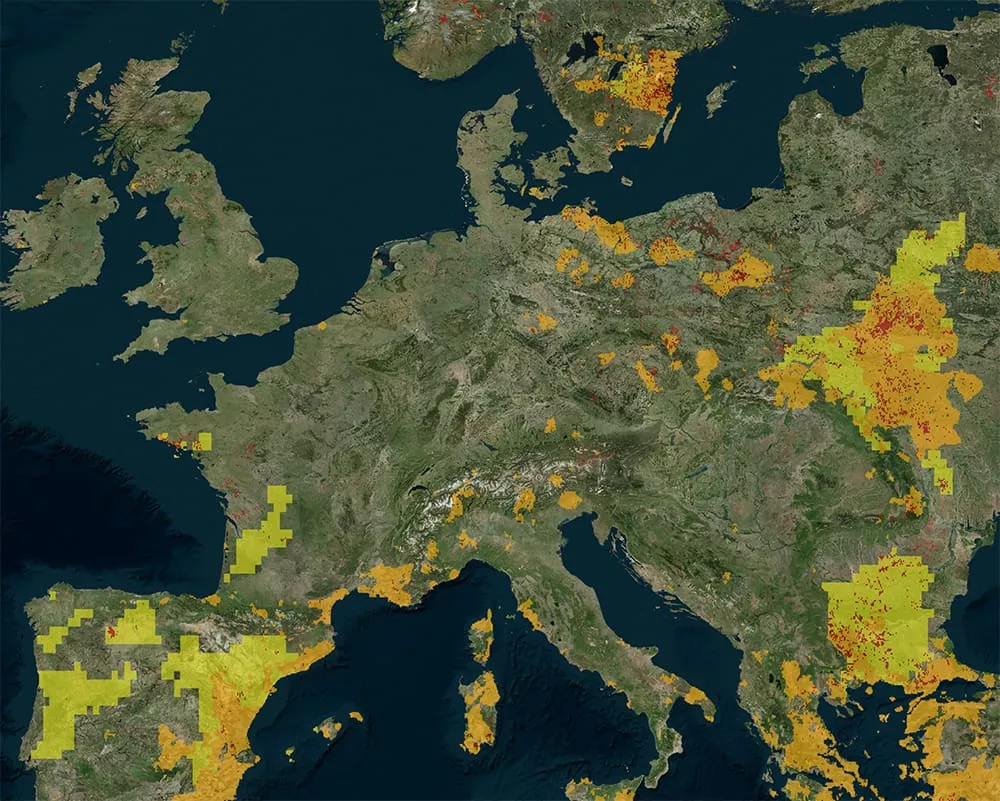
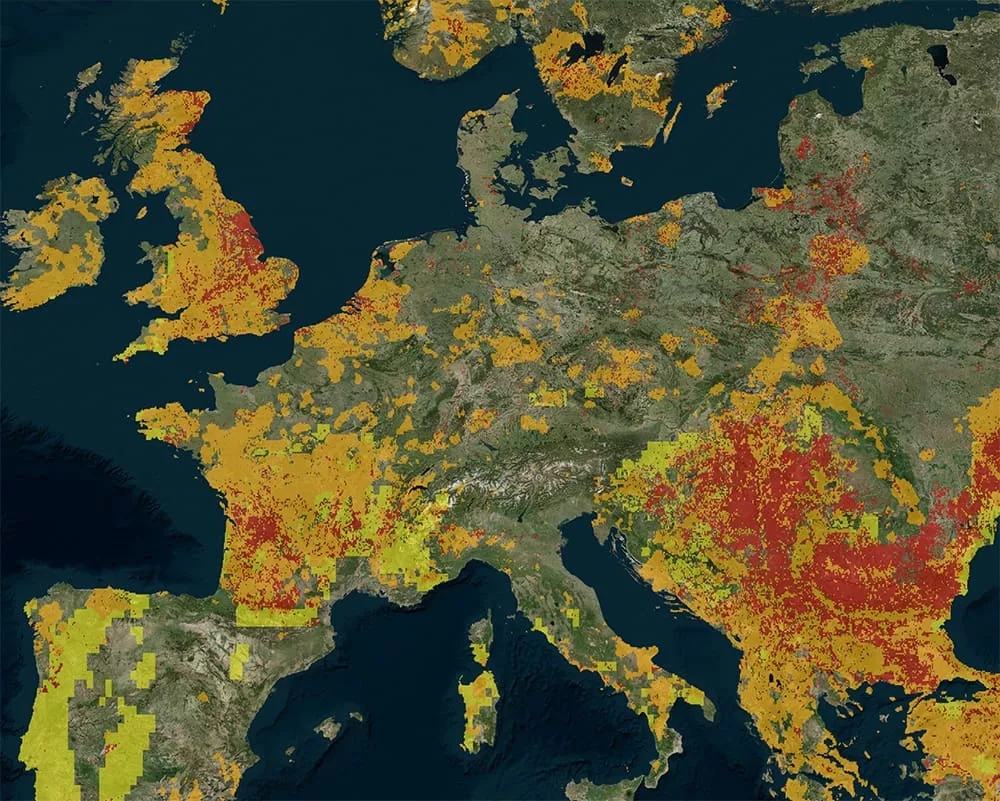
JRC Combined Drought Indicator (CDI v4.1) for 2016 and 2025. The 2025 panel shows Watch, Warning and Alert classes of agricultural drought risk reaching the UK, Ireland, France and central Europe, regions where bank risk models have not historically needed drought-adjusted parameters.
Legacy Approach
For decades, credit risk models were built on the assumption that historical performance provides a reliable guide to future outcomes. Climate change challenges that premise. As extreme weather events become more frequent, severe, and structurally embedded in economic systems, backward-looking calibration and low-granularity data are no longer sufficient.
The climate the models were trained against is itself accelerating. Each new decade is shifting away from the statistical baseline that traditional calibration relies on, with extreme events arriving at frequencies that historical curves did not anticipate. The recent past is no longer a reliable guide to what is coming.
2025 was the third-warmest year on record
Global annual surface air temperature increase above pre-industrial level since 1940.
Data: ERA5 • Reference period: pre-industrial (1850–1900) • Credit: C3S/ECMWF
Global temperatures are now consistently outside the range legacy models were trained against. 2024 was the warmest year on record and the first to exceed 1.5 °C above pre-industrial. 2025 followed only marginally cooler. Models calibrated on pre-2010 climate history are no longer parameterised for the climate banks actually face.
The Asset-Level Gap
The same legacy models also fail at the asset level. Many institutions remain reliant on fragmented internal datasets or legacy modelling frameworks that lack the asset-level precision needed to distinguish between resilient and vulnerable exposures.
This data gap, combined with heavy reliance on heterogeneous and sometimes non-transparent third-party scoring methodologies, introduces elevated model risk and limits transparency in portfolio assessment. Climate risk integration often remains a proxy-based exercise, dependent on sector averages and high-level assumptions that fail to capture asset-specific vulnerability.
The result is not only potential mispricing of risk, but increased exposure to supervisory challenge, qualitative findings, and possible capital implications where methodological approaches fall short of supervisory expectations.
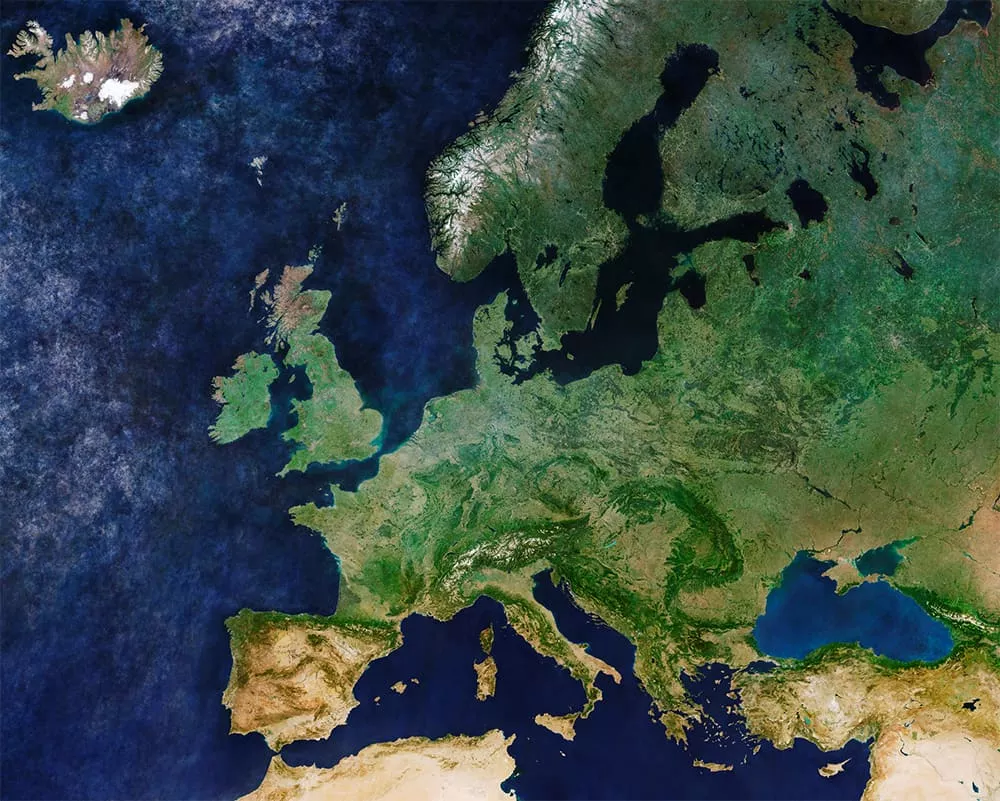
A Common Climate Data Backbone for EU Banking
Earth observation fills the gap that traditional financial datasets cannot. Satellite data provides spatially detailed, harmonised and continuously updated information on climate hazards, asset exposure and environmental change, across borders, asset classes and decades. To meet supervisory standards, that evidence needs to be scientifically defensible, transparent and auditable.
The Copernicus programme delivers it operationally, and its Climate Change Service (C3S) brings together a consistent record of the global climate, from a 1950-to-present observational backbone to multi-decadal projections that reach the end of the century. Through these products, banks can monitor and project the variables that drive credit, market and operational risk under climate stress: temperature trends and heatwave frequency, drought severity and soil moisture deficits, precipitation extremes and flood probability, and the wildfire conditions tied to extended dry spells. Because each variable is delivered with the same methodology across Europe and beyond, banks can establish a common language for climate hazards, with baseline assessments harmonised across jurisdictions and asset classes.
Copernicus data provides a vendor-neutral validation layer for internal or third-party risk models. It follows transparent scientific standards with rigorous calibration and validation, and is widely used to support regulatory reporting and audit.
From these inputs, banks build climate risk models on a simple chain. Hazard, exposure and vulnerability data feed the model: where the climate event hits, what sits in its path, and how each asset responds. The risk engine combines them through Risk = Hazard × Exposure × Vulnerability, running thousands of scenario simulations to produce distributions of possible loss instead of single estimates. The output is finance-ready: Expected Loss and Tail Risk for underwriting and capital allocation, climate-adjusted Loan-to-Value ratios that re-price the collateral behind a loan, and mortgage impairment forecasts for credit provisioning. The same chain gives credit committees, supervisors and external auditors a common evidence base.
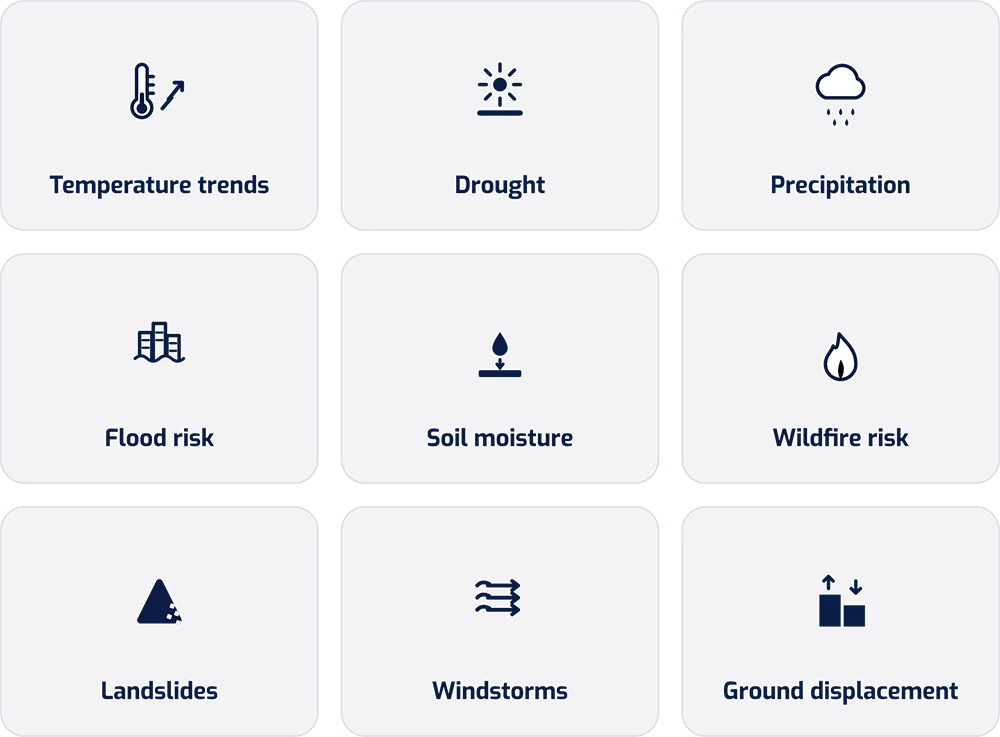
What Copernicus Lets Banks Monitor
Various environmental parameters that drive credit, market and operational risks
From Earth observation to Portfolio Decisions
How Copernicus data flows through a bank's climate risk model
Power of Data Integration
The true transition to climate-smart banking occurs when these hazard layers are integrated with the bank’s own exposure data.
As banks improve the geolocation of their collateral, Copernicus provides the high-resolution hazard data to match that new level of precision.
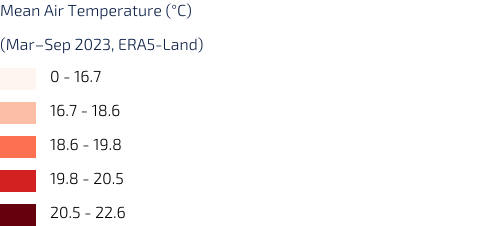
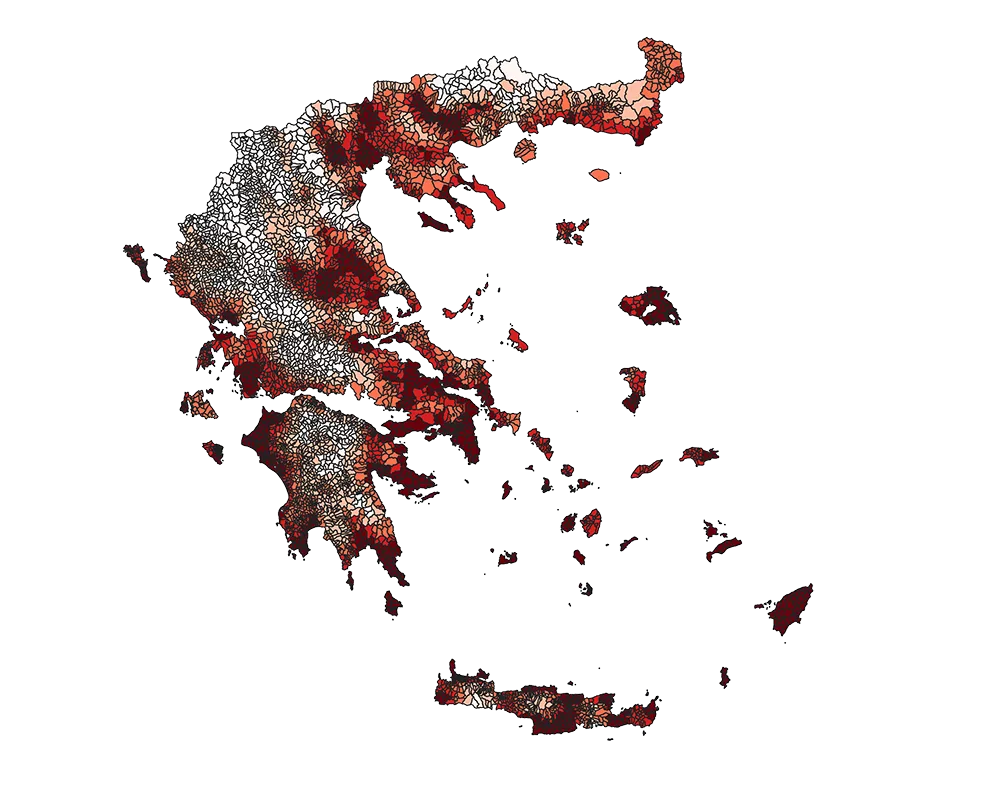
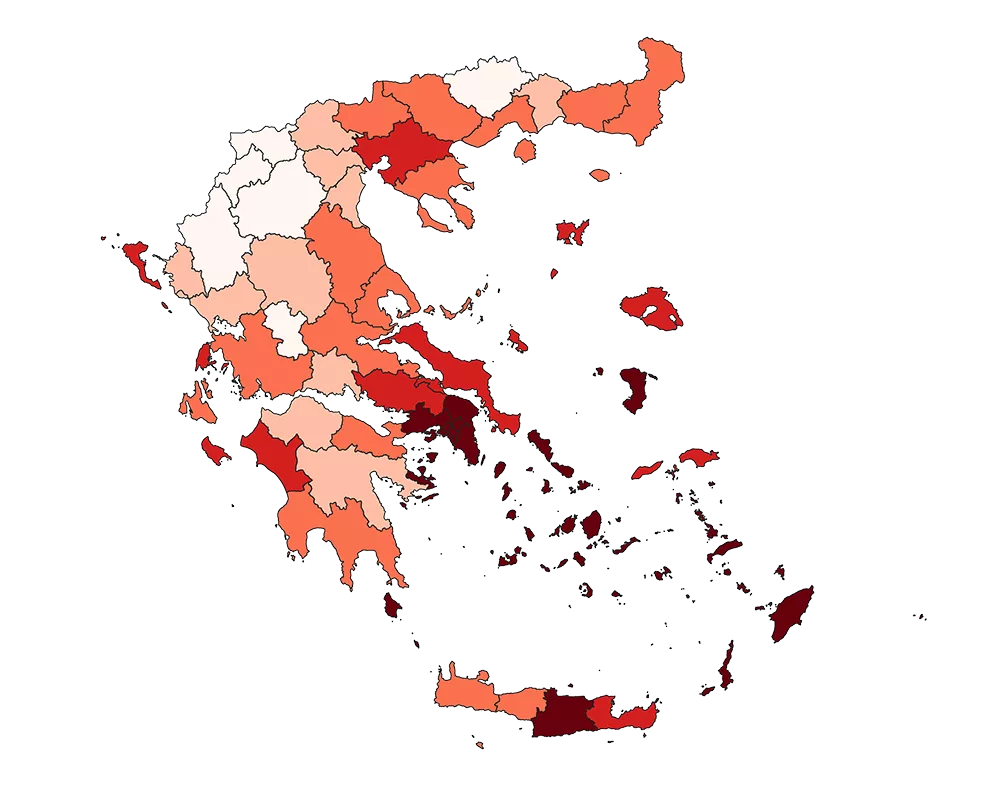
Image shows the difference in air temperature data granularity from NUTS3 level (used traditionally by financial institutions) to the municipality level - enabled by the use of Copernicus data.
High Resolution Asset Exposure
They can identify specific clusters of vulnerability, whether in mortgage books, industrial lending, or infrastructure projects, allowing for a level of precision that transforms climate data into actionable financial intelligence.
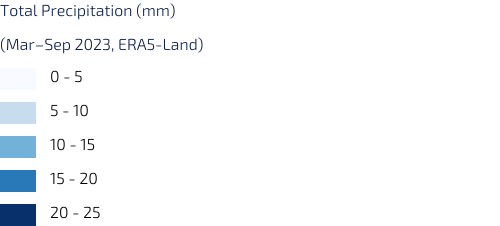
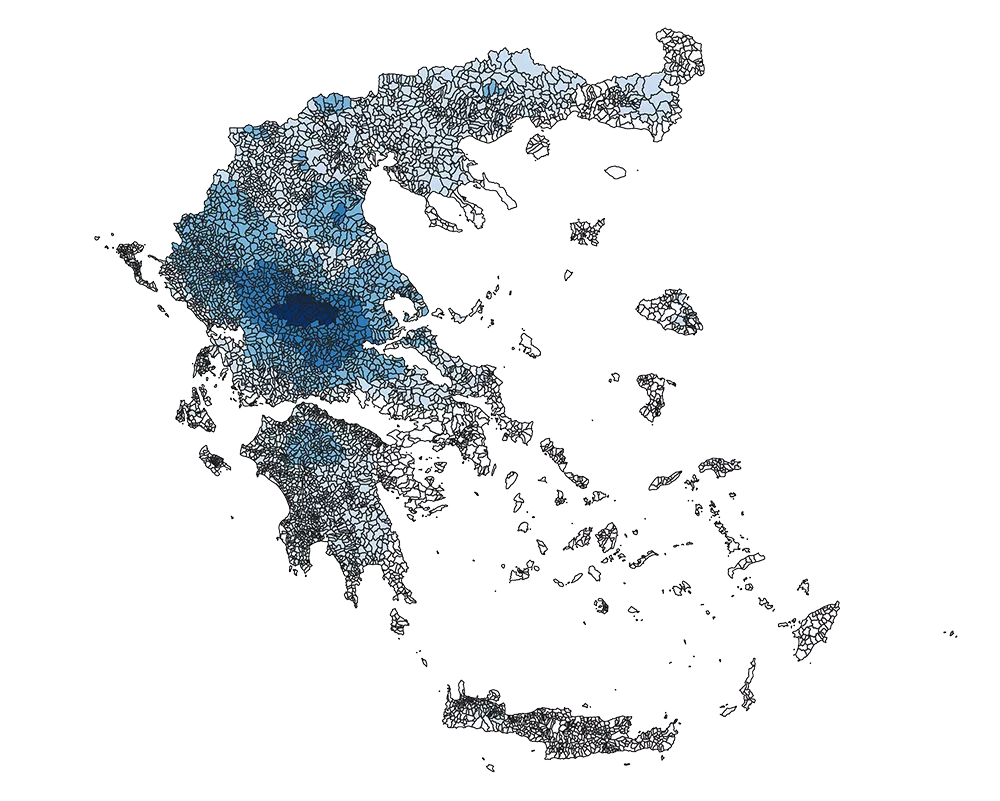
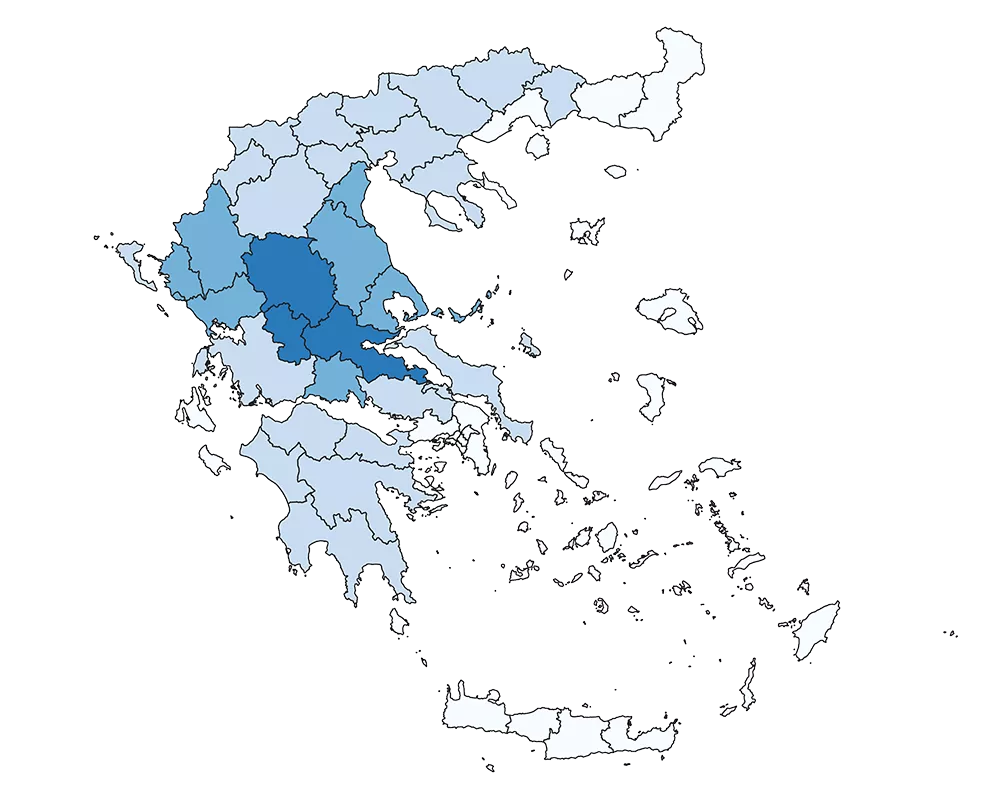
Image shows the difference in total precipitation data granularity from NUTS3 level (used traditionally by financial institutions) to the municipality level - enabled by the use of Copernicus data
Climate Change as a Structural Risk
To strengthen this link, Copernicus satellite data adds a spatial layer of evidence that helps banks understand how chronic climate pressures manifest on the ground.
Sentinel‑1 SAR can monitor surface conditions linked to prolonged soil moisture deficits, highlighting regions where drought has become a structural feature rather than a seasonal fluctuation.
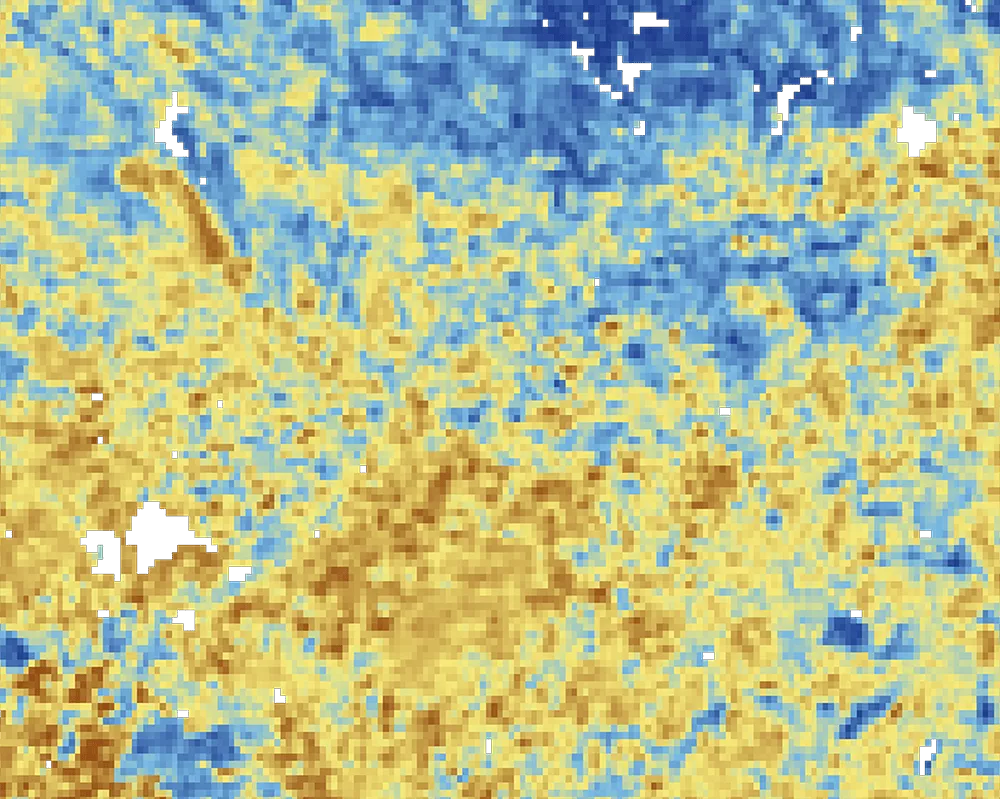
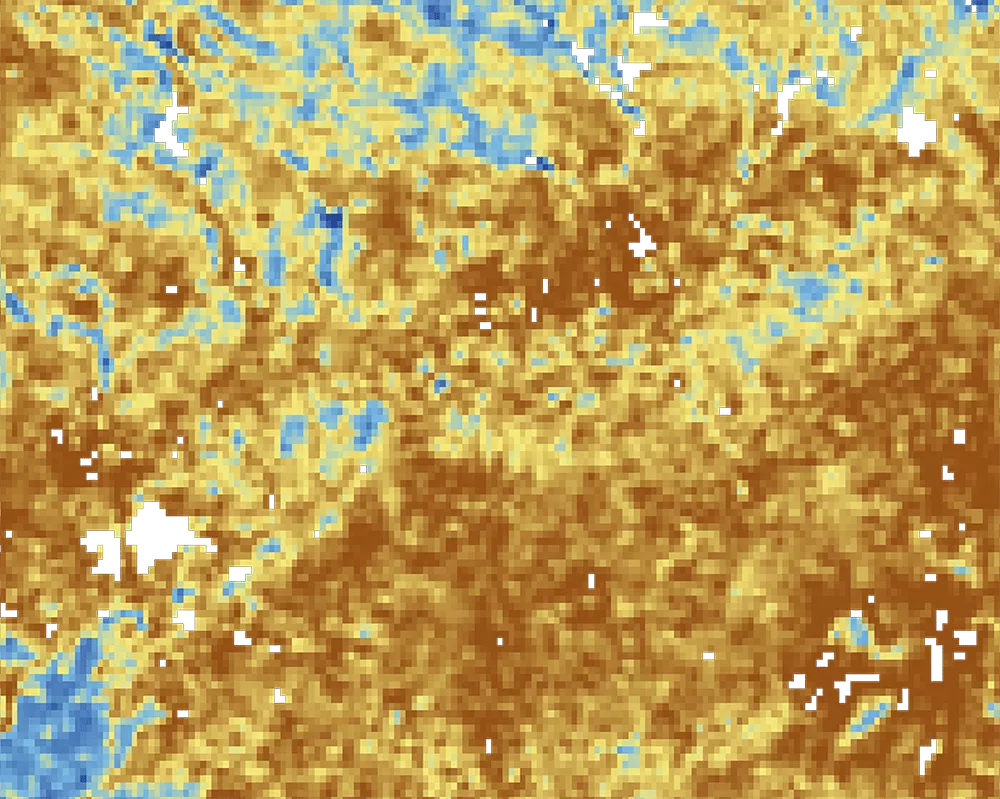
Seville–Cordoba Agricultural Region (Spain)

From Environmental Stress to Credit Risk
Sentinel‑2 optical imagery and land‑cover information reveal how climate stress is reflected in agricultural land, forests, and urban areas, allowing analysts to see how local assets evolve under long-term pressure.
Sentinel‑3 observations of land-surface temperature show how repeated heatwaves accumulate into persistent thermal stress across cities and infrastructure networks, shaping operating costs, energy demand, and local economic activity.
By combining these satellite observations with climate hazard indicators derived from C3S data, banks gain both the long-term statistical perspective needed for regulatory stress testing and the spatially detailed insight needed to connect chronic climate trends to real-world asset exposure. This tightens the link between climate models and the physical conditions that influence credit risk, collateral resilience, and portfolio vulnerability.
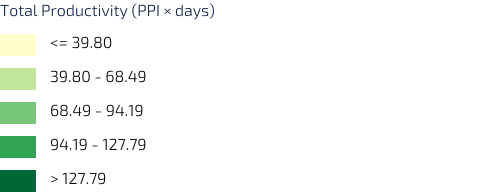


Image shows the degradation of vegetation productivity, including agricultural crops, due to the strong drought that impacted the region during the 2023 vegetation season.
Seville-Cordoba agricultural region. (Spain)
Stress Testing and Forward View
The 2027 stress test asks banks to show how their portfolios would perform under climate scenarios stretching decades into the future. Supervisors use scenarios from the Network for Greening the Financial System (NGFS, the climate working group of central banks) and the Intergovernmental Panel on Climate Change (IPCC) as benchmarks. The Copernicus Climate Change Service (C3S) brings these into the bank's risk toolkit through CMIP6 (a global climate model ensemble) and EURO-CORDEX (its higher-resolution downscaling for Europe), covering temperature, precipitation, drought, flood and sea-level projections at the time horizons banks use for long-term planning.
For risk officers, projection becomes a portfolio question. For example, mortgage books can be re-evaluated against the number of days above 35 °C expected in 2030, 2050 and 2100, with cooling demand, retrofit cost and property valuation effects priced accordingly. Agricultural lending can be tested under drought scenarios that reduce borrower yields and revenues. Industrial collateral, the buildings and equipment securing a loan, can be checked for cooling needs, productivity loss and infrastructure stress decades before the costs land.
Forward-looking analysis does not replace observed data, it extends it. Long-term decisions on lending strategy and capital reserves rest on the same scientific backbone as the bank's regulatory disclosures.
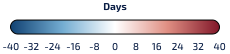
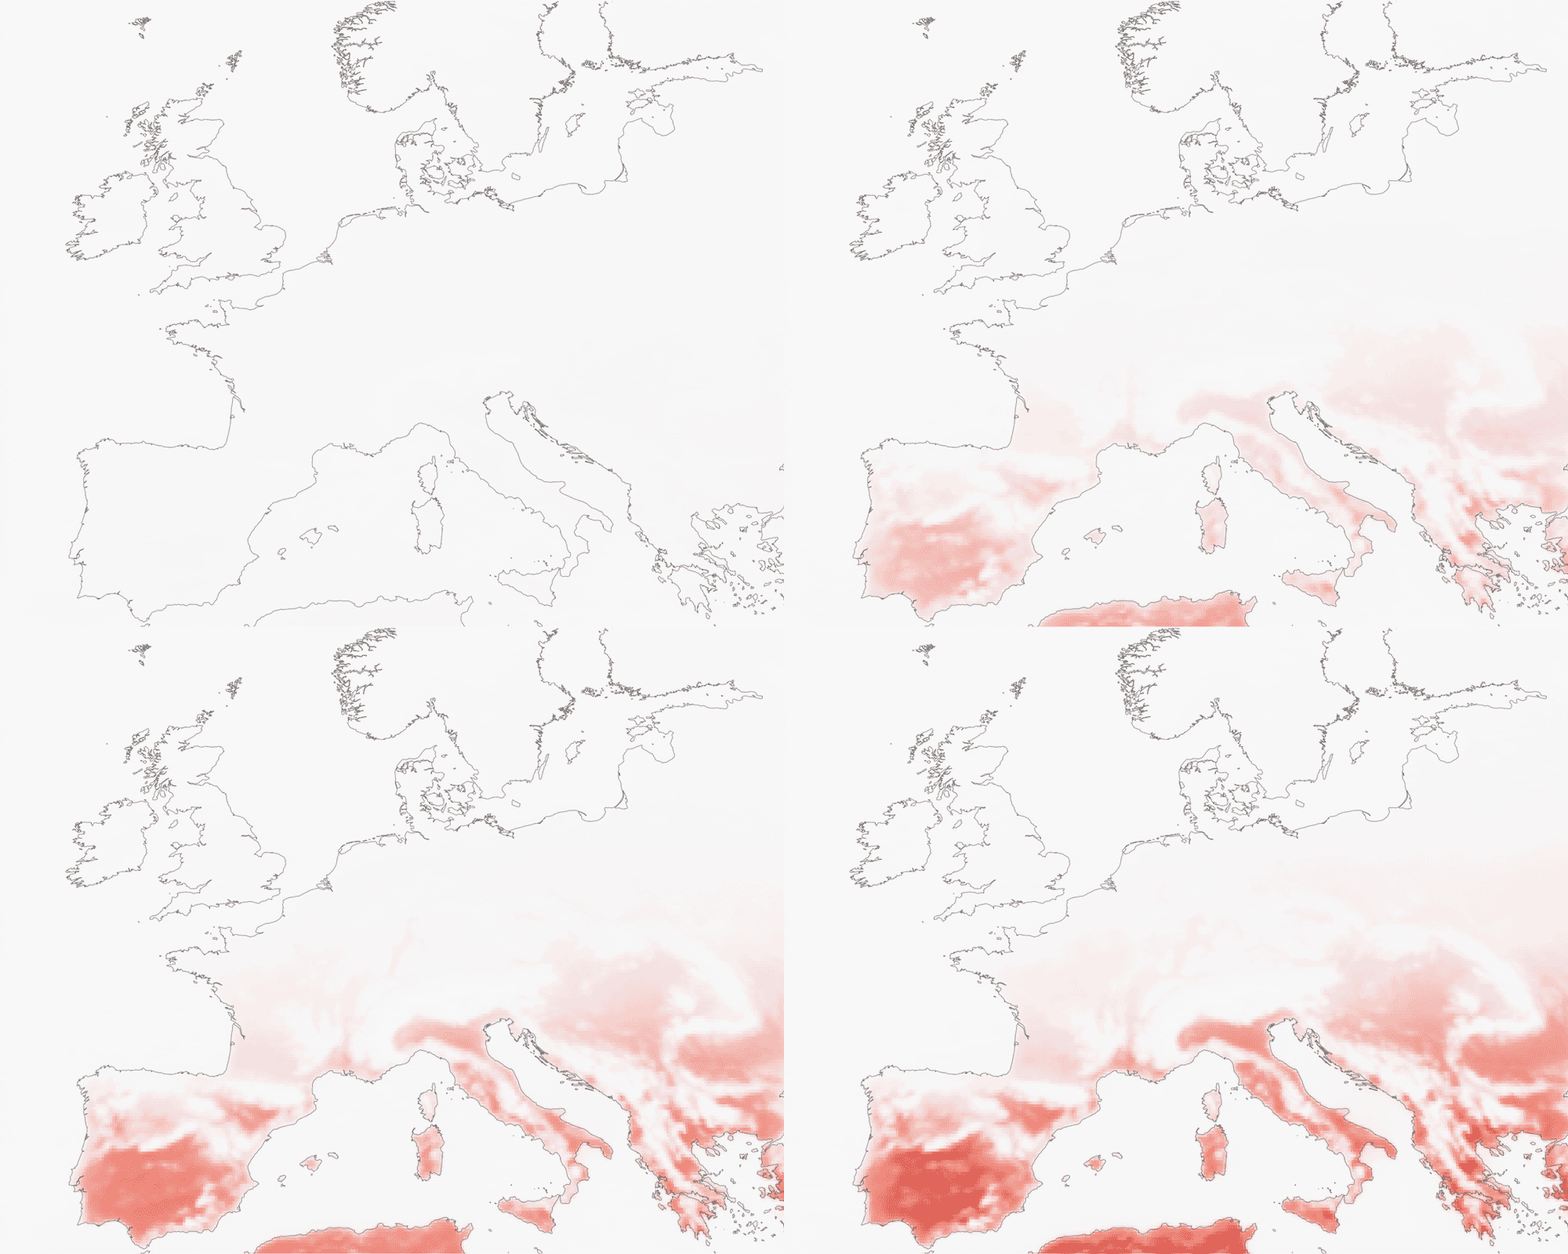
Projected change in the annual number of days above 35 °C across Europe, relative to a 1986–2005 baseline (CORDEX-EUR-11). Extreme heat extends further north and east with each projection window, broadening the geography of cooling demand, productivity loss and asset stress.
Beyond Compliance
Beyond the immediate pressure of compliance lies a significant strategic opportunity. Institutions that build Copernicus data into their core risk management workflows gain a more accurate view of how individual assets respond to climate stress, and a stronger position in client conversations and pricing decisions.
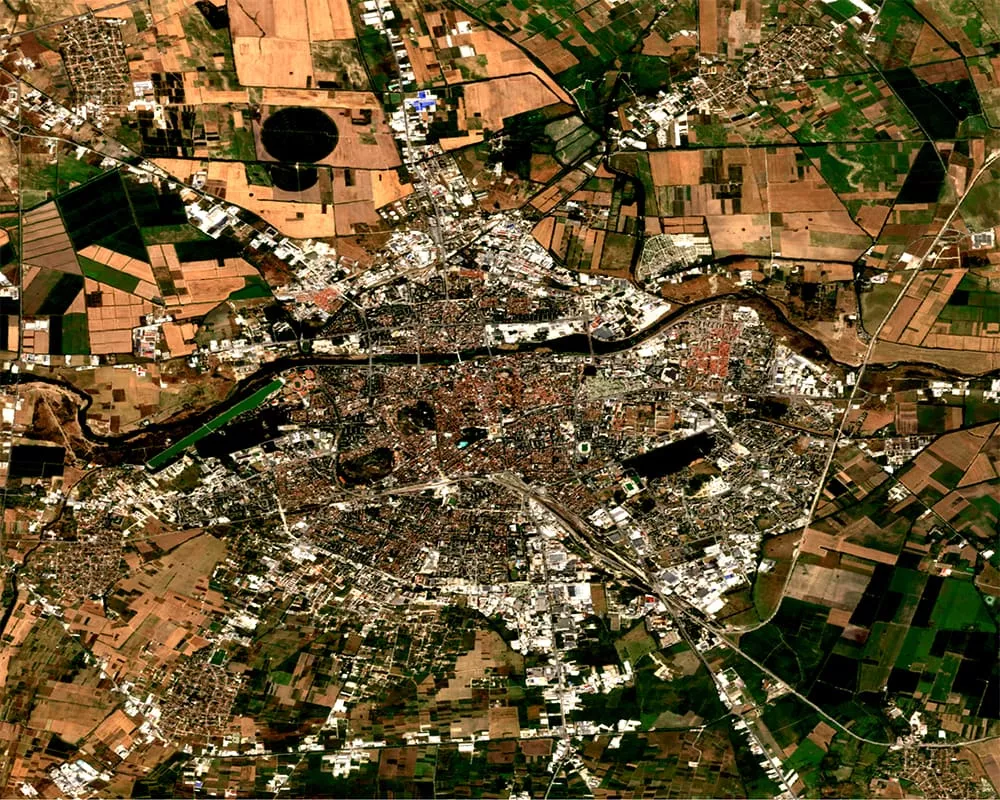
In the eyes of the regulator and the investor, a bank that can demonstrate this kind of granular, data-driven approach to climate resilience is a bank prepared for the long-term shifts now underway in property, infrastructure and credit markets. The Plovdiv example below shows what this looks like at the city level.
Sentinel-2 image of Plovdiv (Bulgaria)
Sentinel-2 image of a densely built district of Plovdiv (Bulgaria). The packed red-roofed surfaces and limited vegetation visible here are precisely the urban form that amplifies the projected temperature rise, with the heat spilling into the adjacent properties and infrastructure.
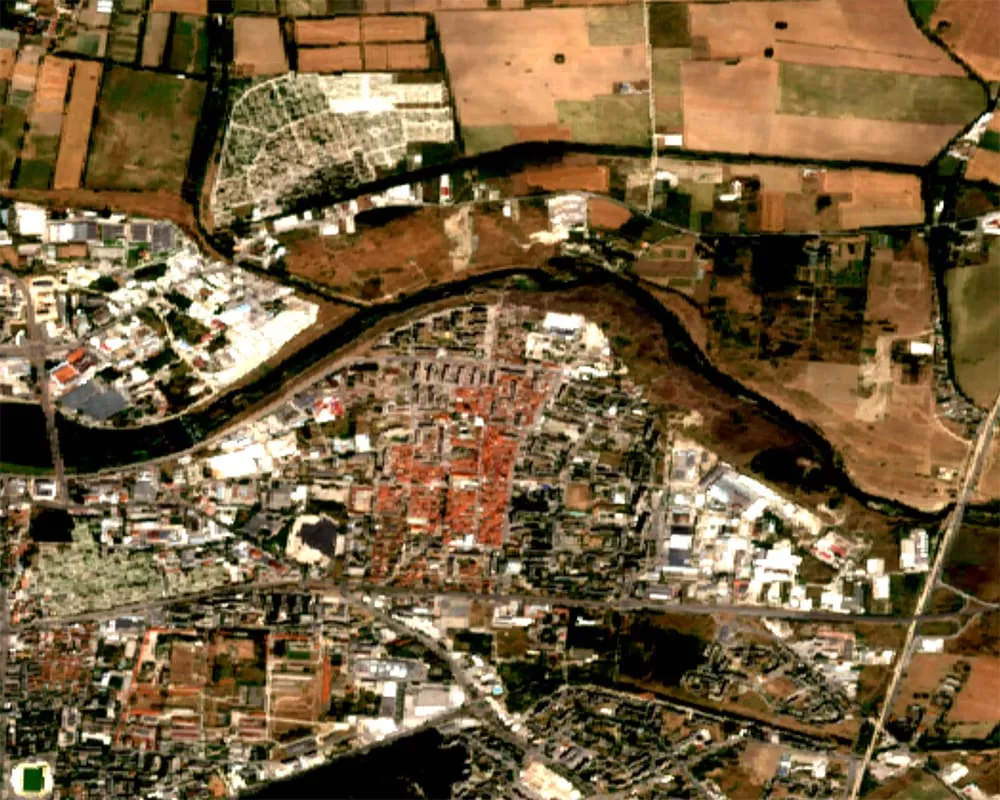
Sentinel-2 image of Plovdiv (Bulgaria)
Max temperature (°C) - RCP-4.5
The chart projects maximum air temperature at the Plovdiv site through year 2100 (the standard time horizon, chosen to span the maturity of mortgages, commercial real-estate loans, and infrastructure finance) under RCP-4.5 ( moderate-emissions climate scenario in which global emissions peak around 2040 and decline thereafter).
The increase lands unevenly across the city. Densely built neighbourhoods with limited green infrastructure absorb and retain more heat than greener districts, pushing the local rise above the city-wide average and concentrating risk on mortgage and commercial real estate in those areas.
For a bank, mapping this intra-city differentiation supports location-specific risk pricing, physical climate risk assessment, and green-lending products with preferential terms for climate adaption retrofits.
Who benefits
from Copernicus?
Across the European financial sector, Copernicus is becoming a shared evidence base for managing climate risk. Its free, open and consistently delivered datasets give institutions, supervisors and investors a single starting point for analysing how climate change affects portfolios, capital and long-term value.
Commercial and retail banks can use Copernicus data to ground credit risk in observed and projected conditions on the ground. The same satellite-derived inputs that feed climate scenarios for stress testing also support day-to-day lending decisions, collateral revaluation under physical risk, and the asset-level evidence supervisors expect to see behind portfolio scores.
Supervisors and banking regulators can draw on Copernicus climate data to define benchmarks for the climate scenarios they ask banks to test against. Because the same datasets are available to every institution under review, supervisory dialogue can focus on methodology and implementation.
Asset managers and institutional investors can integrate Copernicus information into portfolio screening, due diligence on climate-related disclosures, and use climate projections from C3S for longer-term decisions on capital allocation across sectors and regions. The result is a more defensible view of how physical and transition risks translate into investment performance.
Freely available, scientifically validated and continuously updated, Copernicus data can turn climate risk from a reporting obligation into a shared analytical foundation for the European financial system.
Explore this
further with us
Copernicus offers free and open Earth observation data.
Long term continuity commitment enables other industries build bespoke workflows
and services for their operational needs.
EUSPA can help interested stakeholders explore which Copernicus datasets and indicators are most relevant for their operational needs, how they can be turned into dashboards, alerts or reporting tools together with EO service providers.