Volume change monitoring
- Raw materials
Mine operators face constant pressure to anticipate how waste facilities evolve before capacity constraints become operational risks. Here is how Earth observation transforms scattered observations into site-wide intelligence for smarter volume-change management.
-
billion tonnes
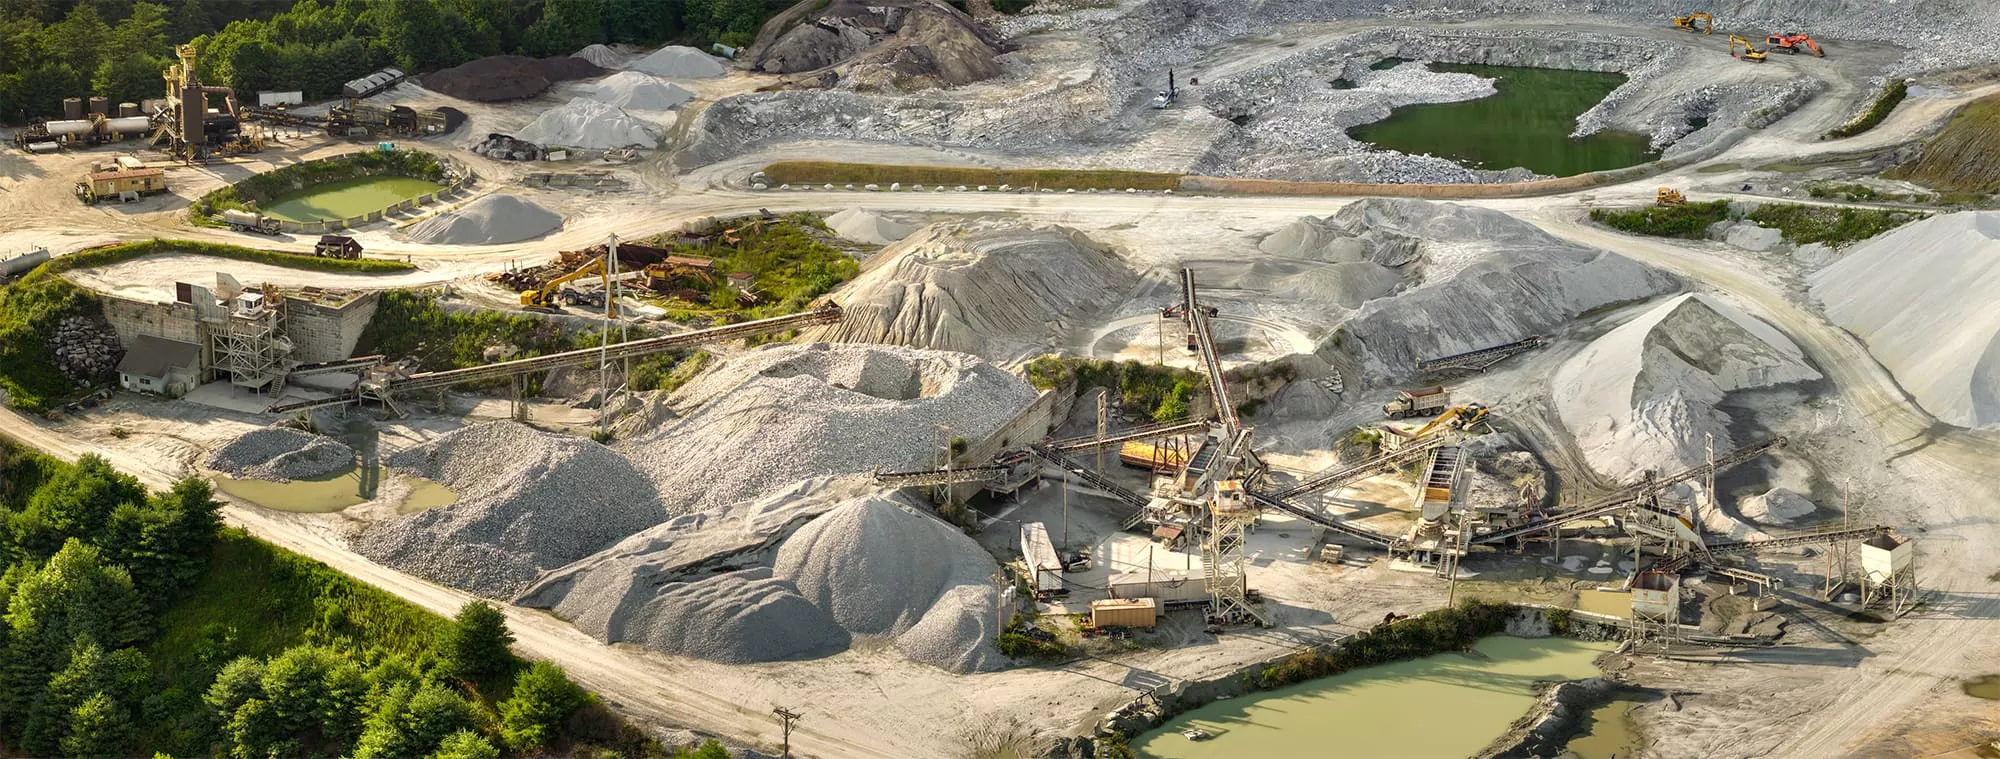
of tailings — the waste left after extracting metal — are produced every year. It is the world's largest waste stream, held across roughly 8,500 storage facilities whose volume must be tracked over time.
Volume change monitoring (waste materials)
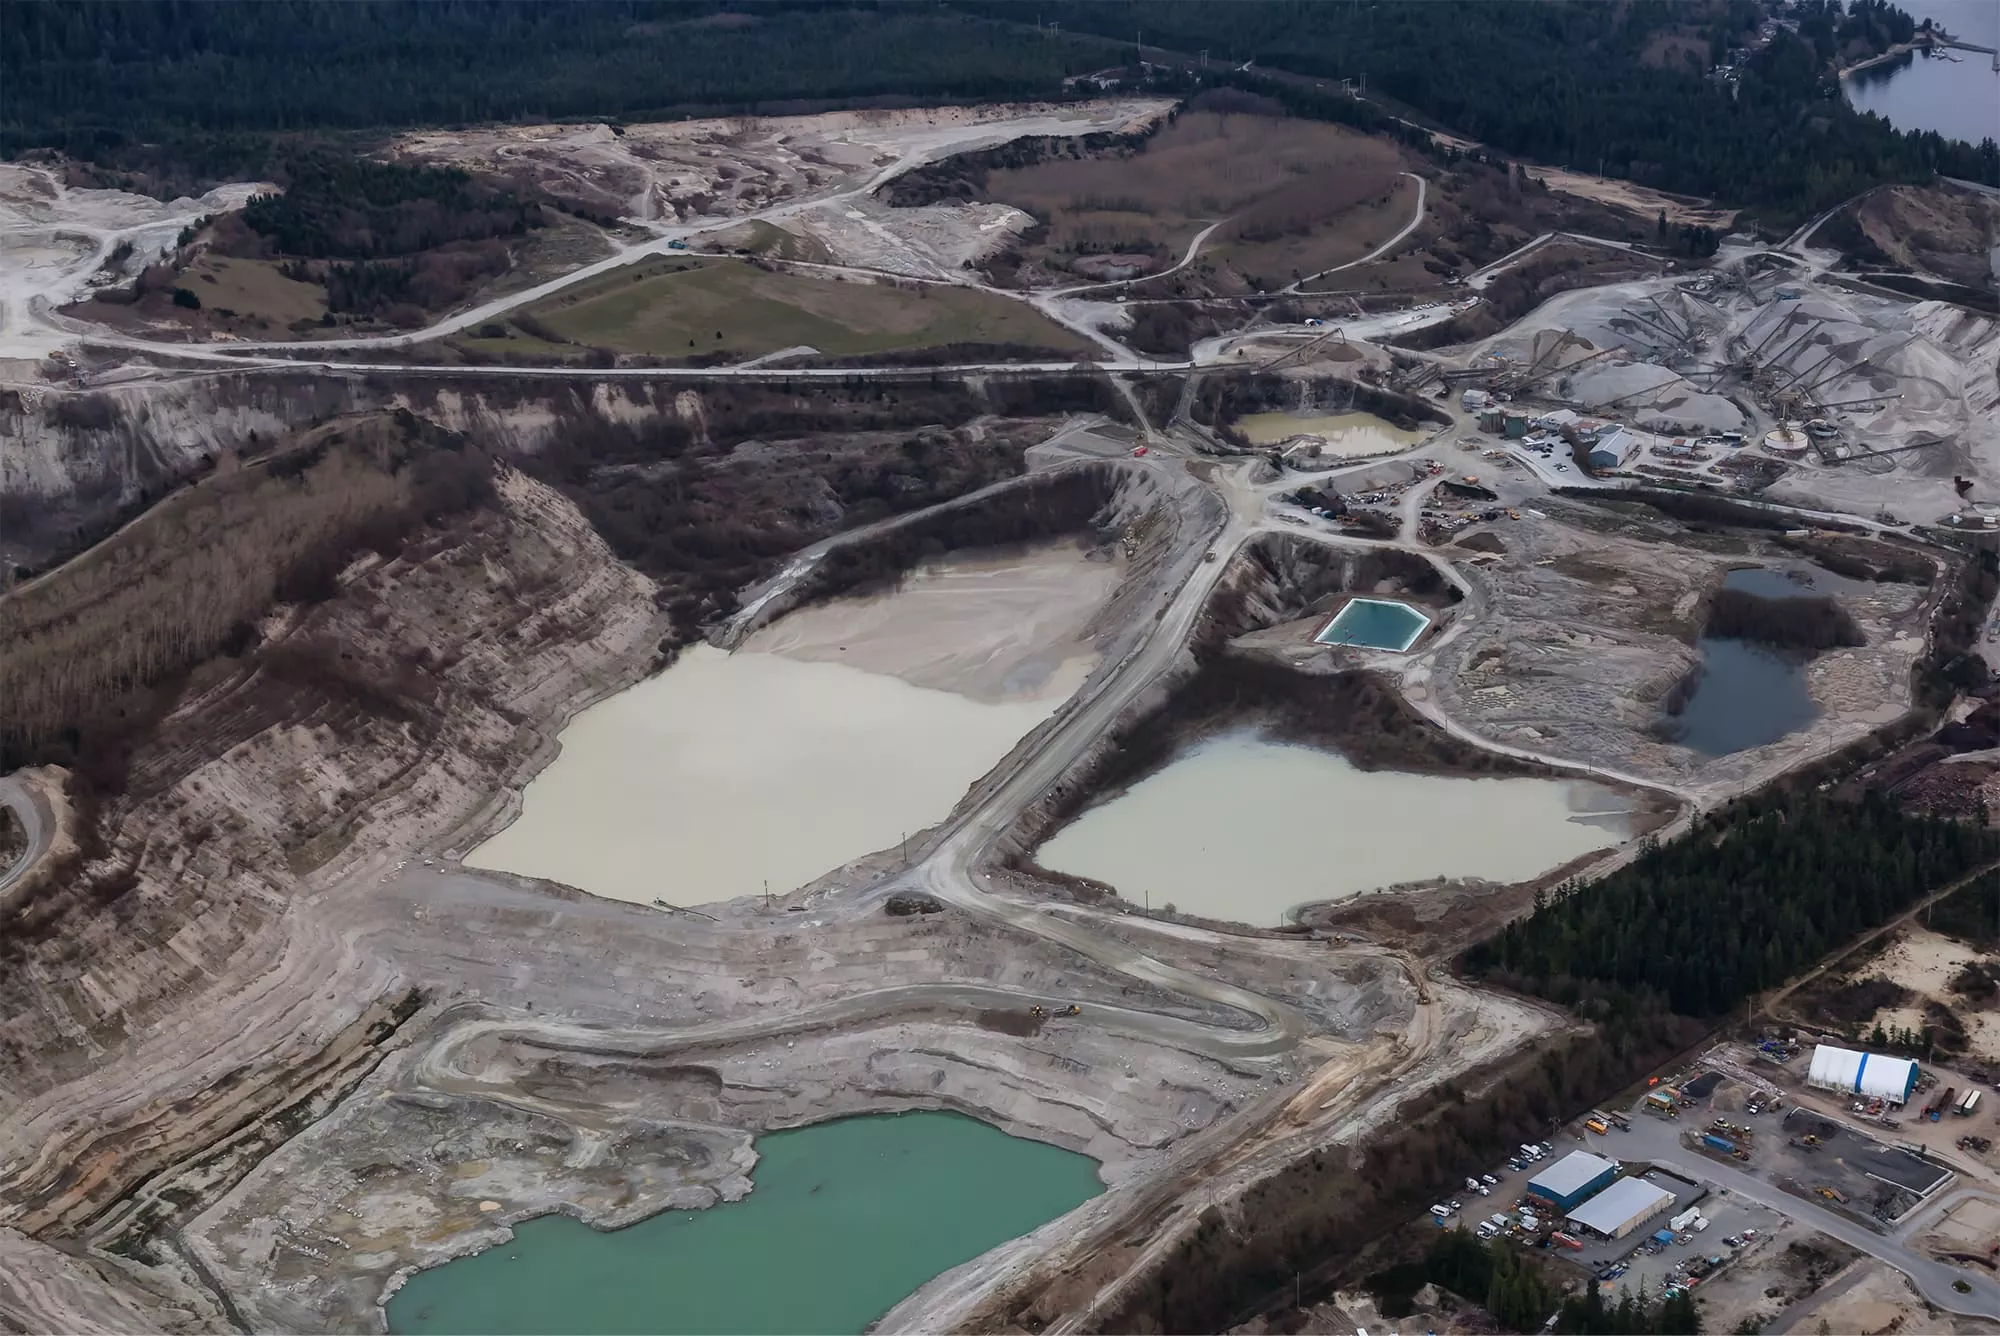
At a mine site, the Mine Waste/TSF manager has to answer a few practical questions: which dump, stockpile or tailings cell is filling fastest, how much free space remains, and when a critical threshold be reached? These are not occasional questions but rather daily operational planning.
Waste-rock dumps, tailings storage facilities (TSFs) and ore stockpiles can change continuously as material is added or moved. However, the areas where they are allowed to expand, their design capacities and their required safety margins are fixed by permits and engineering constraints. The problem for the operator is therefore not simply “measuring volume” but understanding change early enough to avoid operational surprises. If growth is detected too late, the site may have to accelerate engineering works, change deposition plans at short notice, or face restrictions linked to storage capacity or permit conditions.
This matters because even relatively small vertical/lateral changes can translate into large additional material volumes. Traditional volume accounting based on periodic topographic/LiDAR surveys, drone checks, GNSS measurements or manual assessments can be accurate, but also costly and intermittent. Between one campaign and the next, the end user may have only a partial picture of what is happening across several facilities. That makes it harder to detect unexpected growth patterns, compare facilities consistently, and trigger high-accuracy surveys at the right time rather than too early or too late.
For mine operators, late detection can translate into higher remediation or construction costs in the multi million euro range (e.g., EUR 10–12 million for the expansion of Atalaya Mining’s Riotinto tailings facility in Spain, indicating investments scale that can be critical if not planned in advance), operational disruption, additional reporting effort, and pressure from regulators, communities and investors.
Introducing EO
This is where Copernicus can help, providing data on a free and open basis, as a first-level screening layer across multiple mine facilities. Rather than replacing in-situ surveys, Copernicus helps the Mine Waste/TSF manager identify where the change is occurring, how quickly it is progressing, and which facilities should be prioritised for targeted follow-ups (e.g., UAV/LiDAR surveys).
In practical terms, instead of treating every dump, stockpile or TSF cell as equally urgent, Copernicus can be used to screen the full site and quickly highlight where the footprint is expanding, where activity is concentrated and where thresholds may be approached faster than expected (an example is the MOSMIN project).
This matters because it improves planning decisions and allows to produce auditable maps and time series (e.g., facility polygons, change metrics, activity flags, atmospheric corrections, etc). Indeed, if a fast-growing facility is identified earlier, the operator has more time to sequence deposition differently, prepare engineering works, organise the next targeted survey, and avoid last-minute mobilisation.
The benefit is therefore not only technical, but also operational, as it reduces the risk of reacting too late and spending money in a rushed, less efficient way. Also, having dated map-based records of where, how and why the facility footprint changed matters for mine operators, as poor evidence often leads to extra verification, multiple internal checks, slower reporting and weaker position in discussions with regulators and auditors.
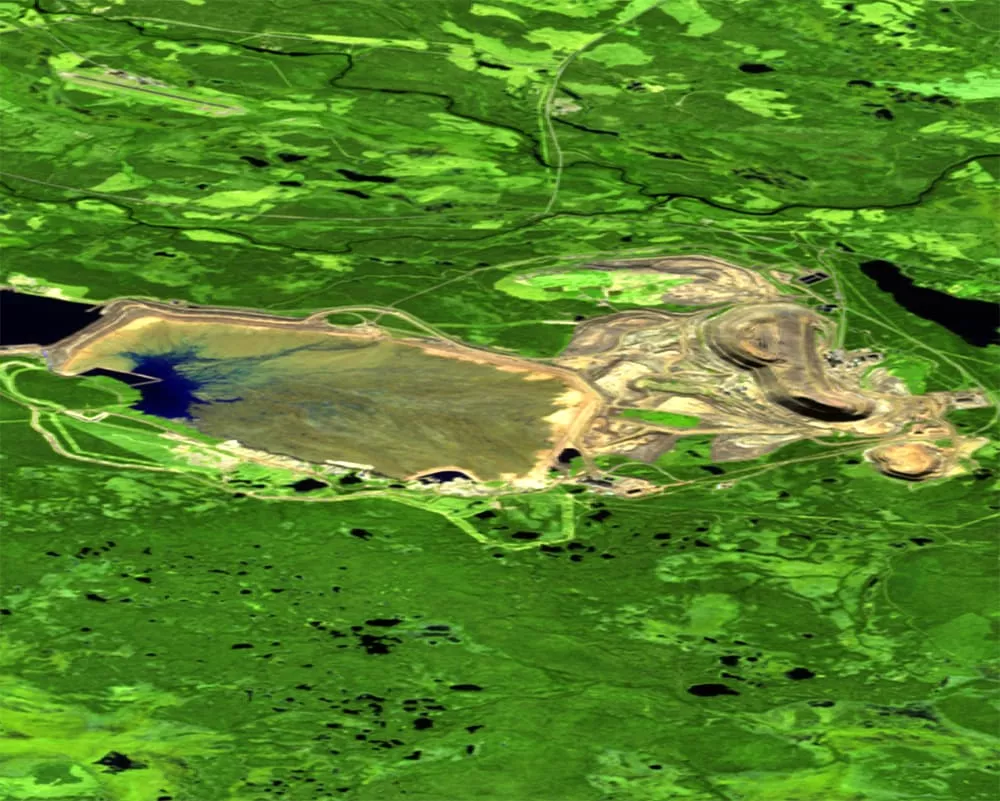
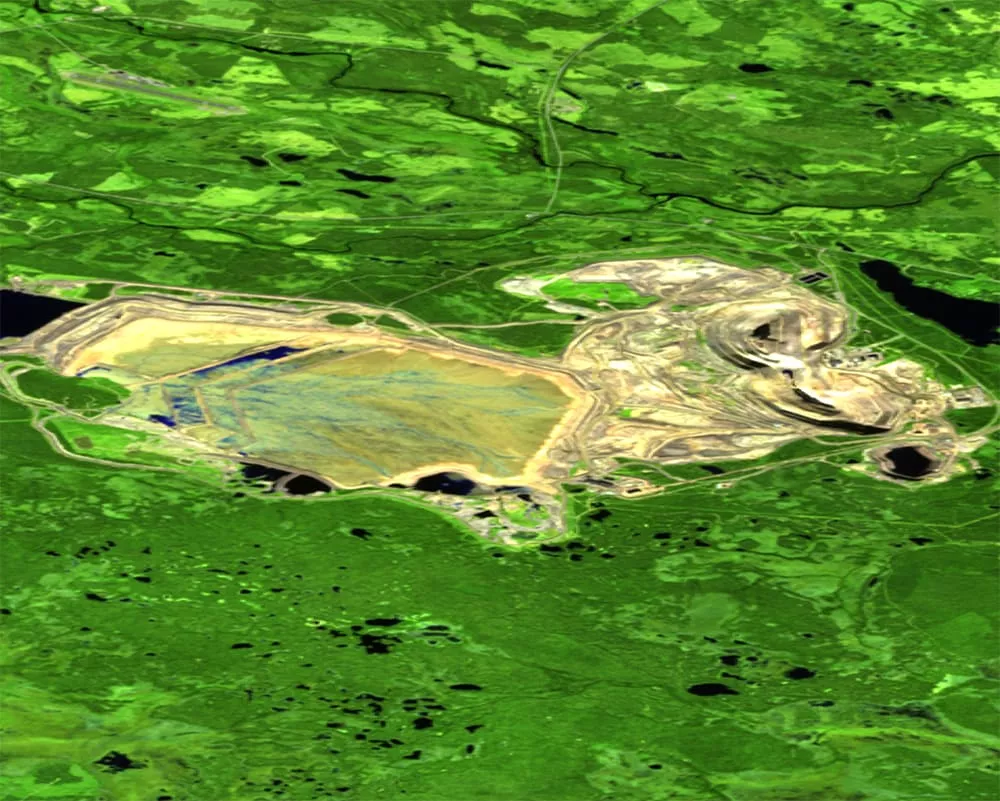
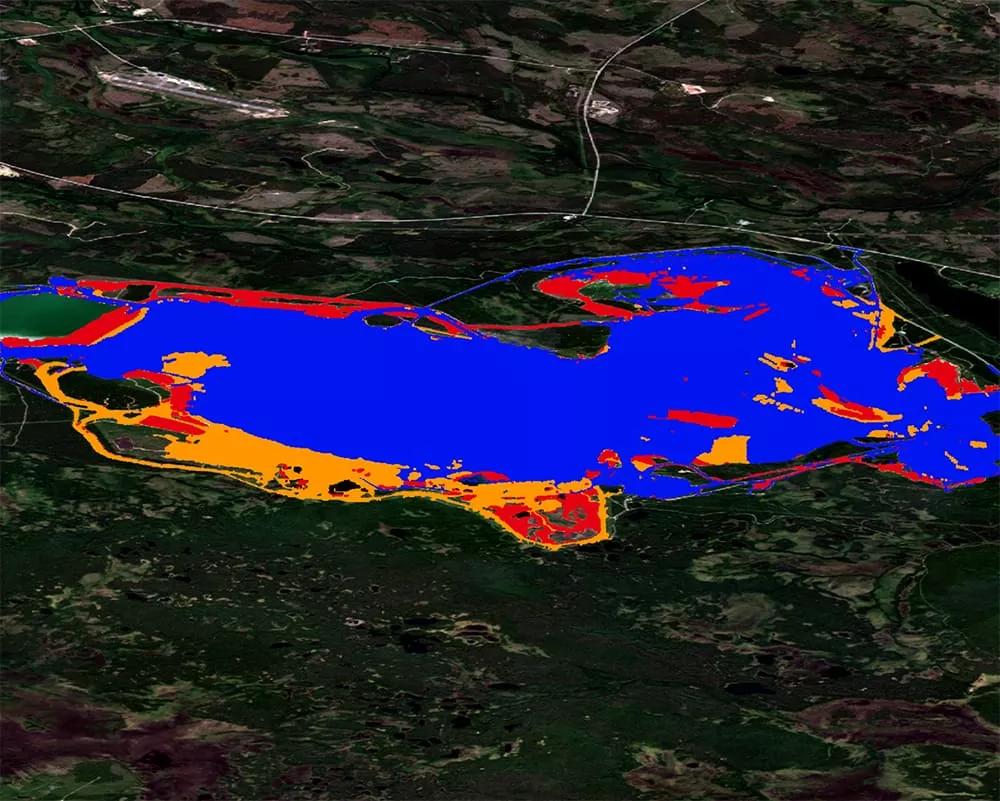
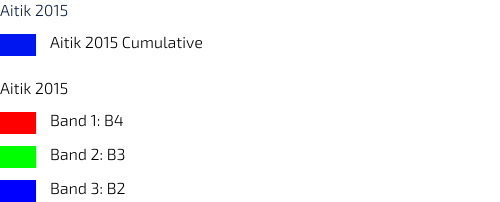
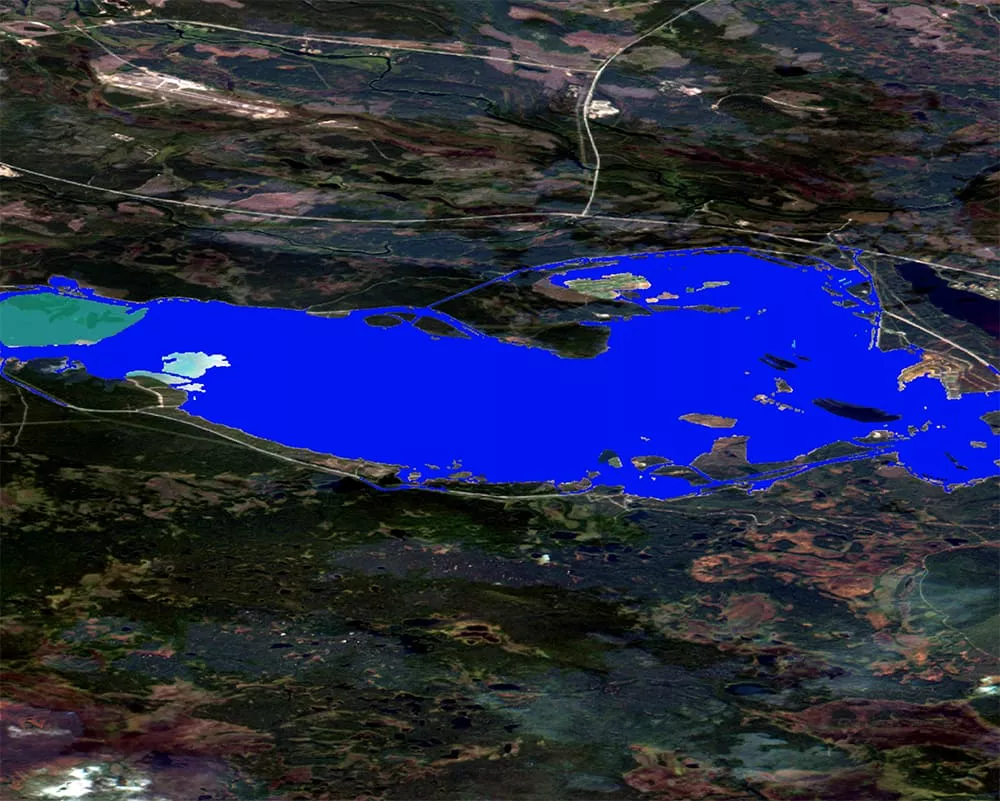
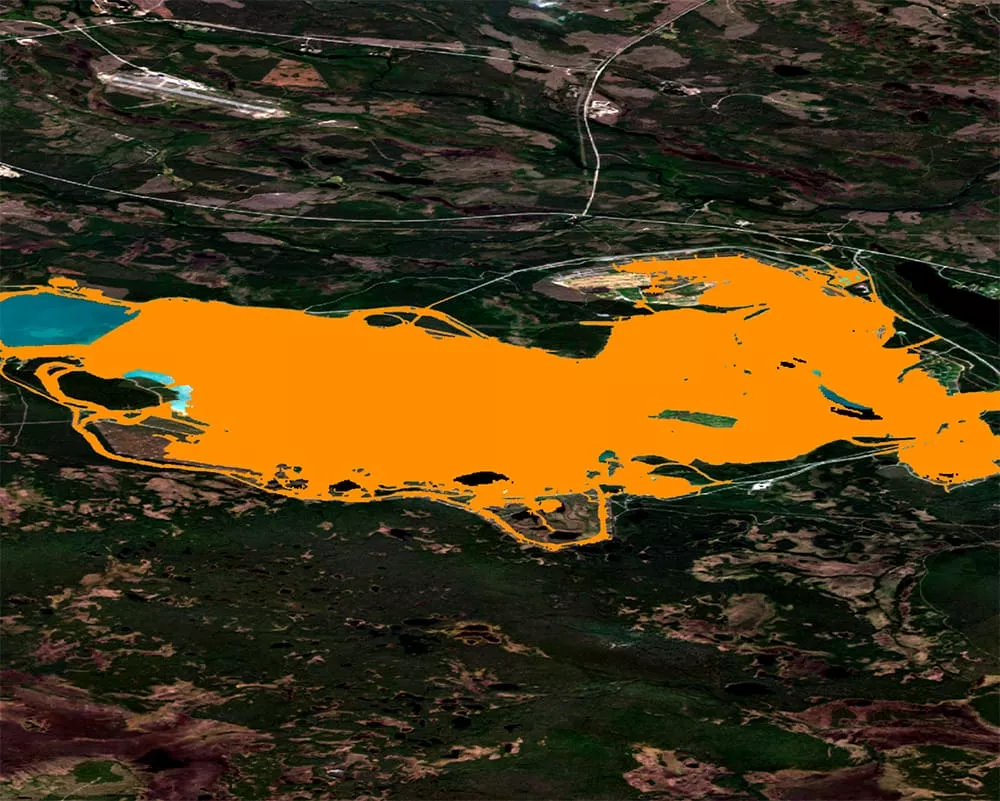
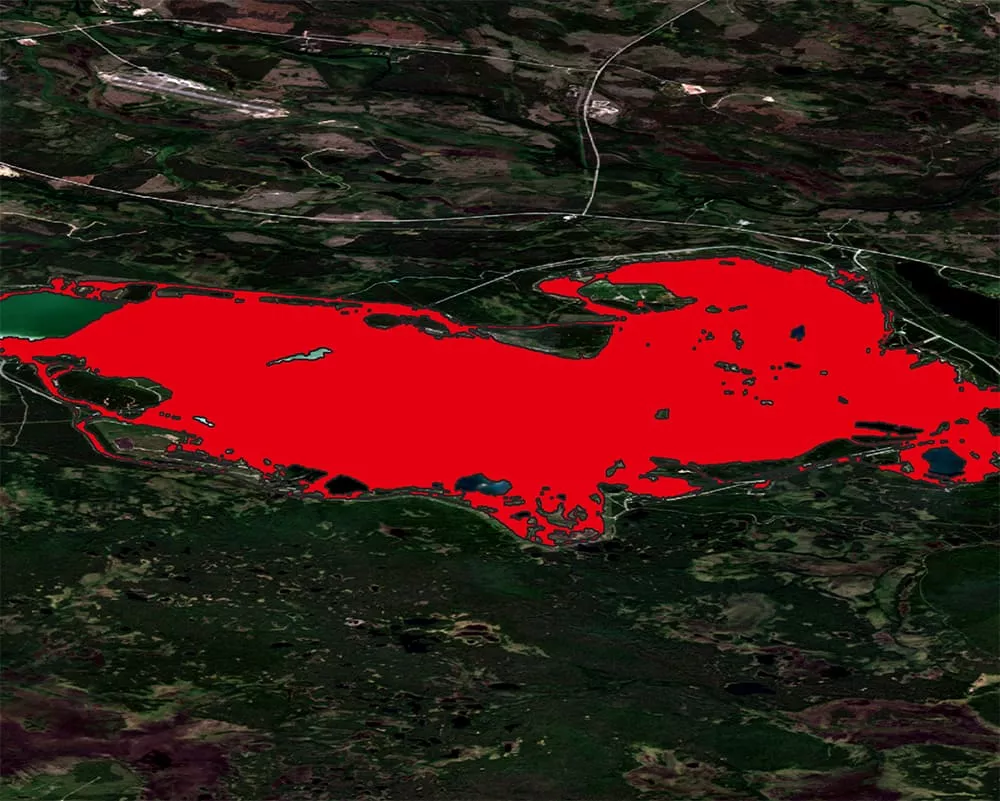
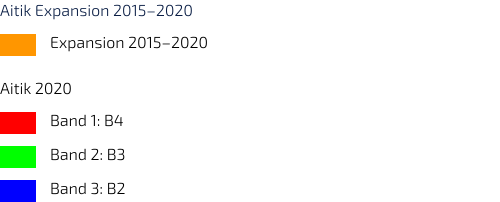
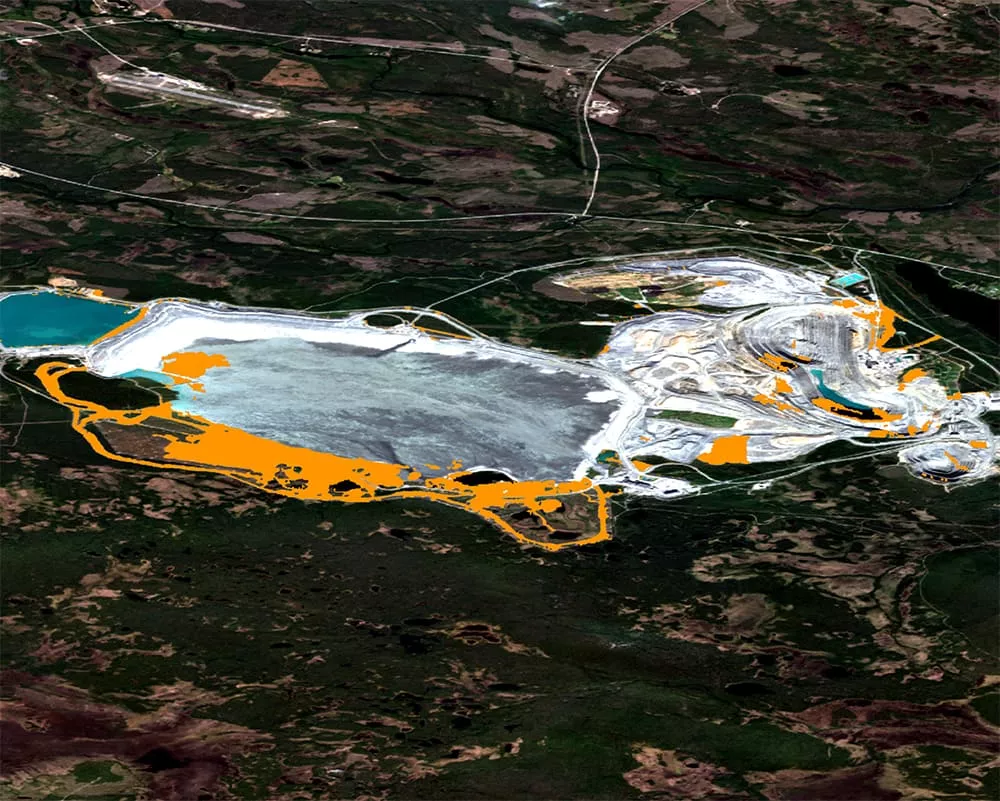
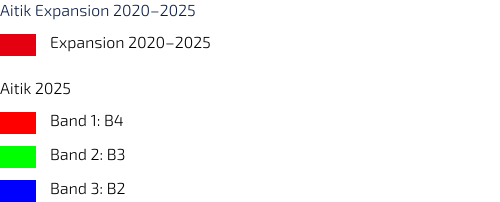
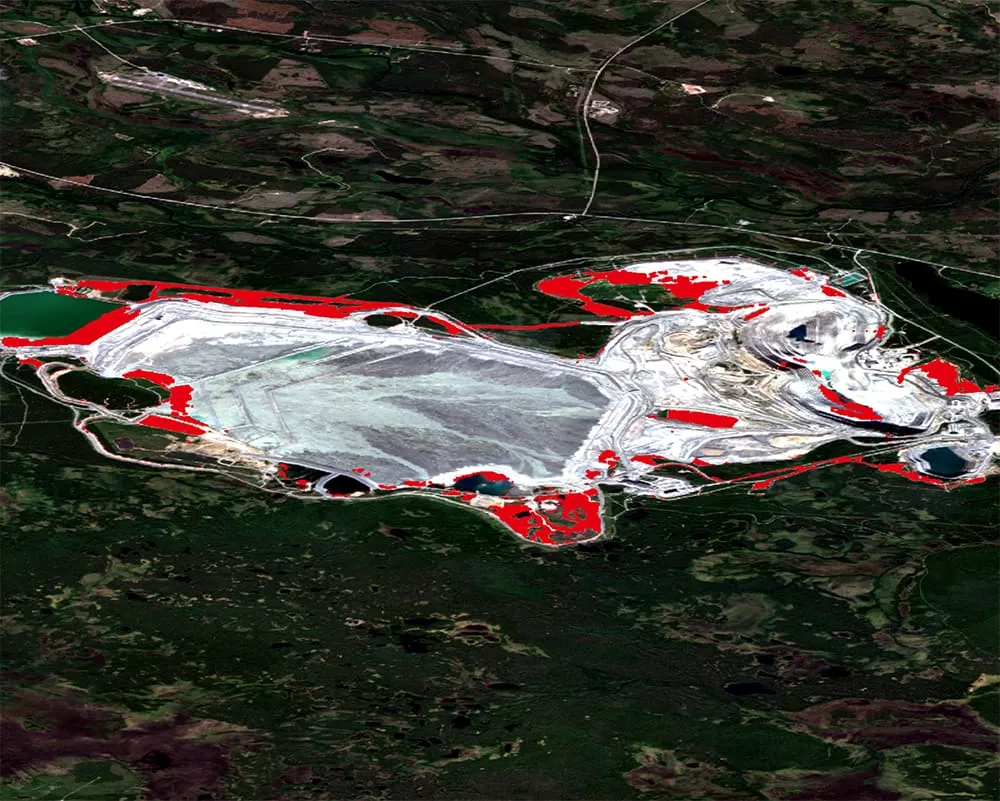
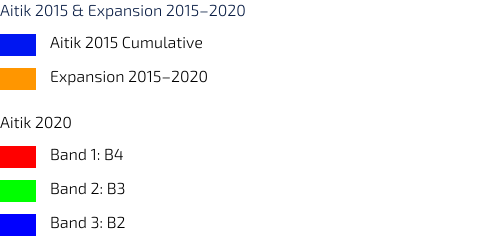
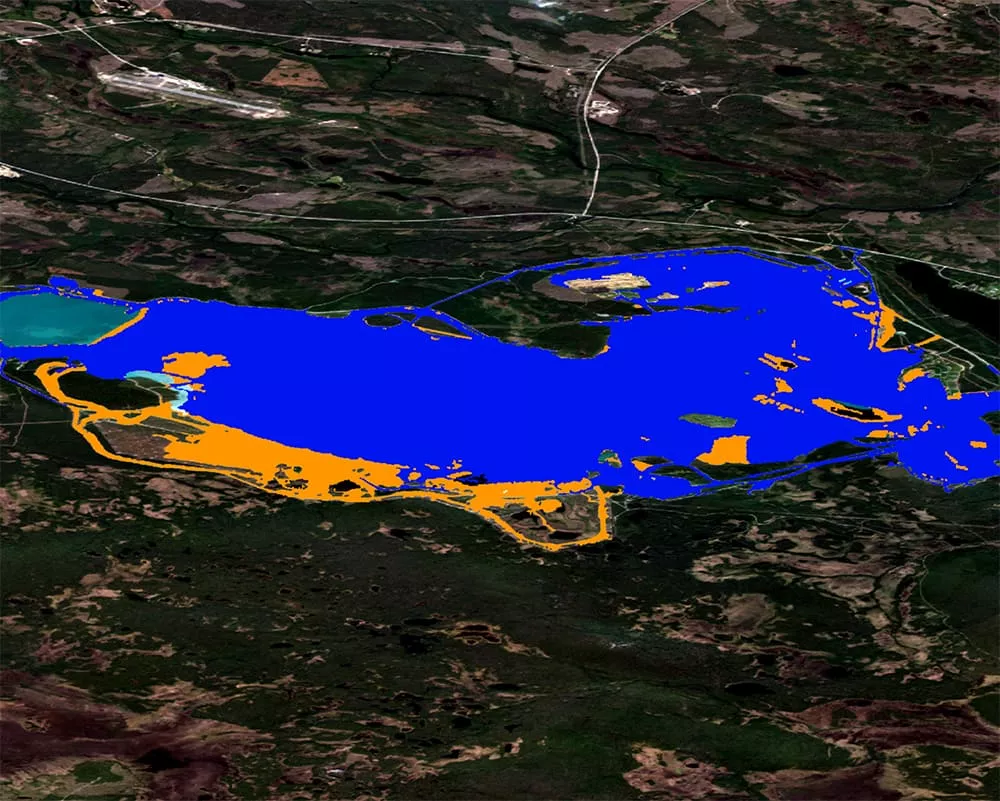
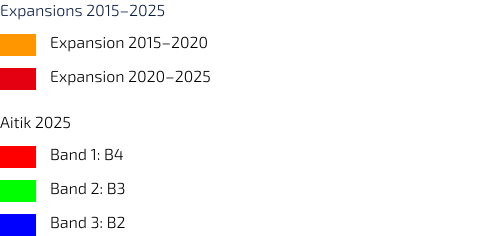
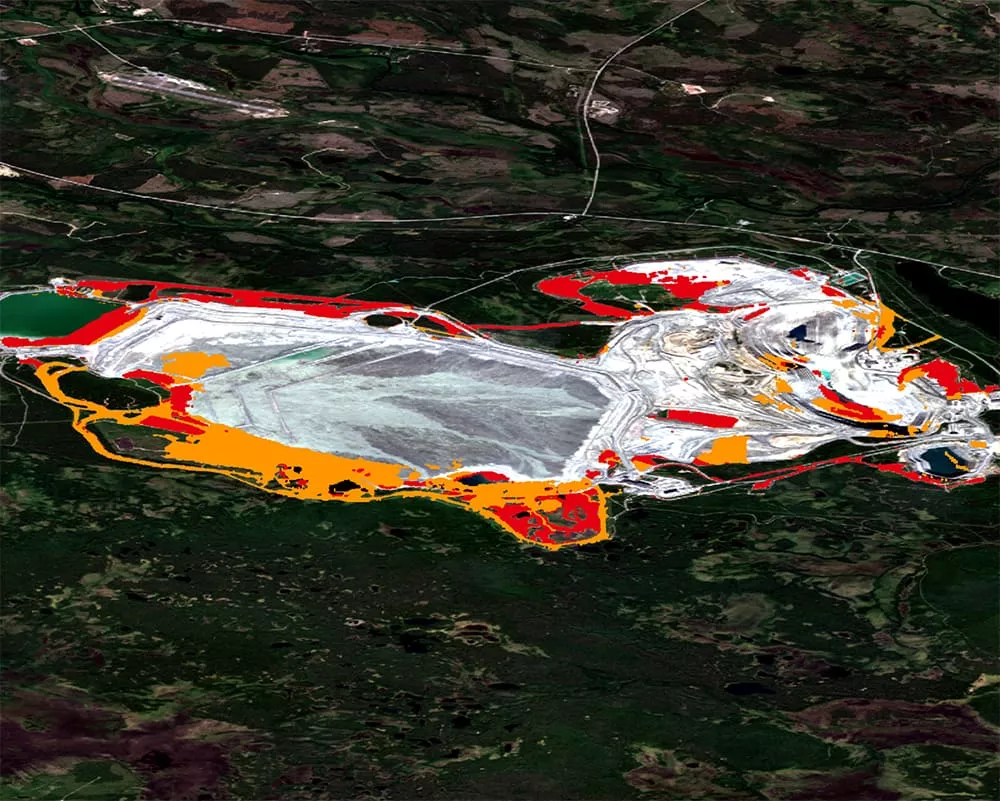
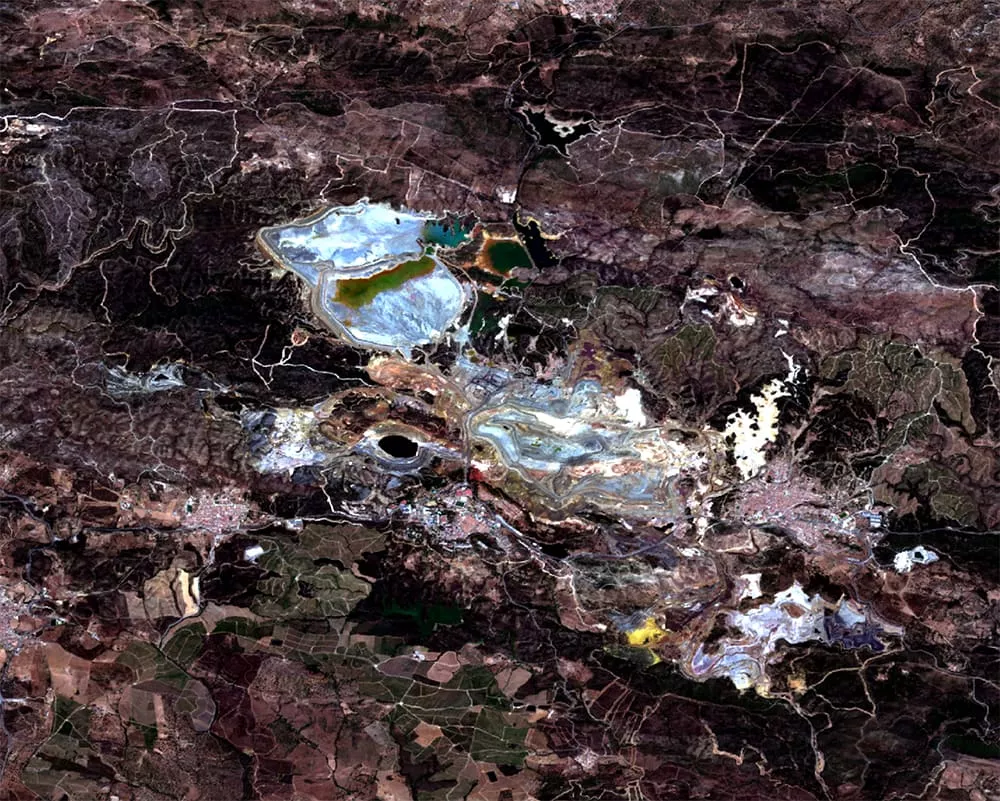
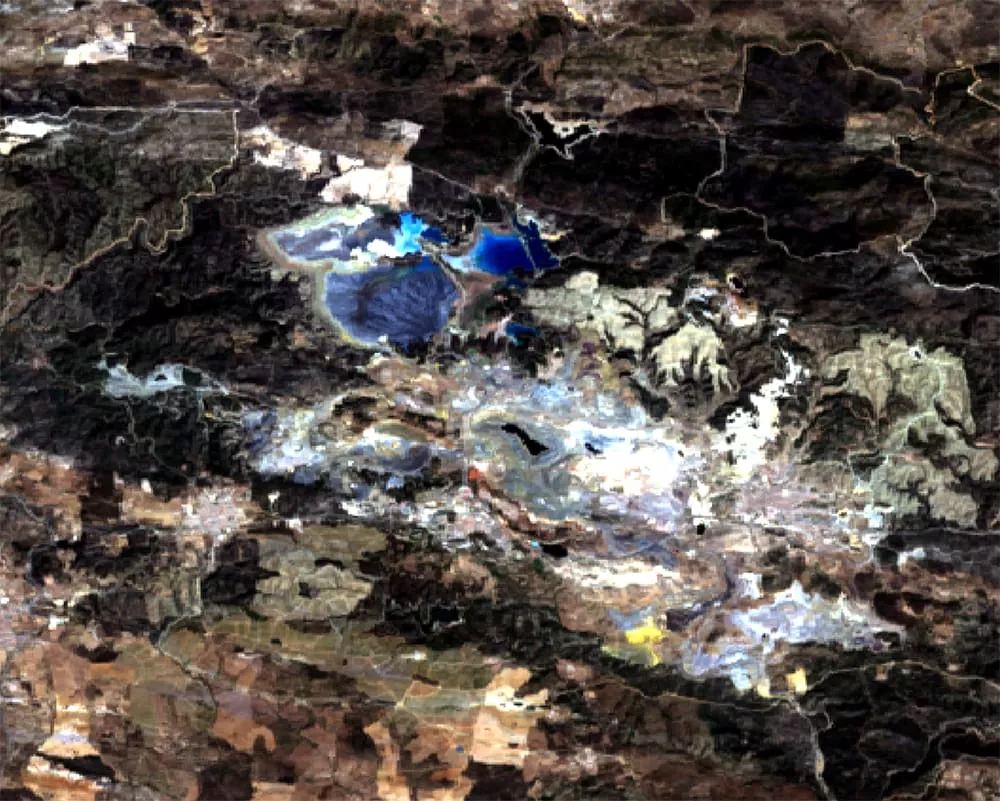
This short-wave infrared (SWIR) visualisation delivers high-contrast material differentiation to optimise operational monitoring. Healthy vegetation is rendered in vibrant green, while active mining zones, tailings storage facilities (TSFs), and waste-rock stockpiles stand out in distinct gold and beige tones. This comparison clearly reveals the expansion of the facility's footprint, tracks structural modifications in the waste infrastructure, and pinpoints critical areas of change over a seven-year period.
Footprint and height change proxies
Copernicus Sentinel-2 multispectral imagery is well suited to delineate the footprint of waste facilities and track horizontal expansion over time. This supports practical questions such as: "Has the dump expanded beyond its permitted boundary?" or "Which cell of the TSF is currently being used?"
A practical example is a mine with five storage or waste areas under routine observation. If Copernicus screening shows that four facilities appear broadly stable but one waste-rock dump has expanded noticeably over recent image acquisitions, the operator can prioritise that facility for a more detailed survey instead of deploying the same effort everywhere. The benefit is therefore not that EO replaces precise survey methods, but that it helps use them more selectively and at the right moment.
However, to move from "what changed" to "how much changed", additional processing is usually required. Copernicus acts best here as the first-level free screening layer capable of rapid footprint delineation and change detection. Once change thresholds are exceeded, targeted high-accuracy surveys can then be triggered to refine height and volume estimates only where they are really needed. This supports smarter planning and an optimised number of in-situ campaigns.
More precisely, Copernicus data can involve:
- Footprint polygons: classification or index-based segmentation can separate waste materials (bare ground, tailings beaches) from surrounding land cover, producing time-stamped polygons that can be compared against permitted boundaries.
- Activity indicators: Sentinel-1 radar can highlight persistent surface disturbance or changes even in cloudy conditions, helping identify active deposition zones.
- Heights/volume indicators: volume is typically estimated by differencing digital elevation models (DEMs) between dates, and/or by combining footprint area with periodic high-accuracy elevation surveys. Copernicus DEM can support broad-scale context and first-order estimates, but further integration with other datasets is needed higher-resolution elevation data (e.g., UAV, LiDAR).
Tailings footprint area — Aitik mine
Area (ha) per survey year, with % of illustrative permitted capacity
Source: Copernicus Sentinel-2 footprint delineation
Better context overview for better decision making
Copernicus helps provide a better overview of the context for volumes management. This helps the Mine Waste/TSF Manager have a clearer and more up-to-date site-wide picture of which facilities are changing.
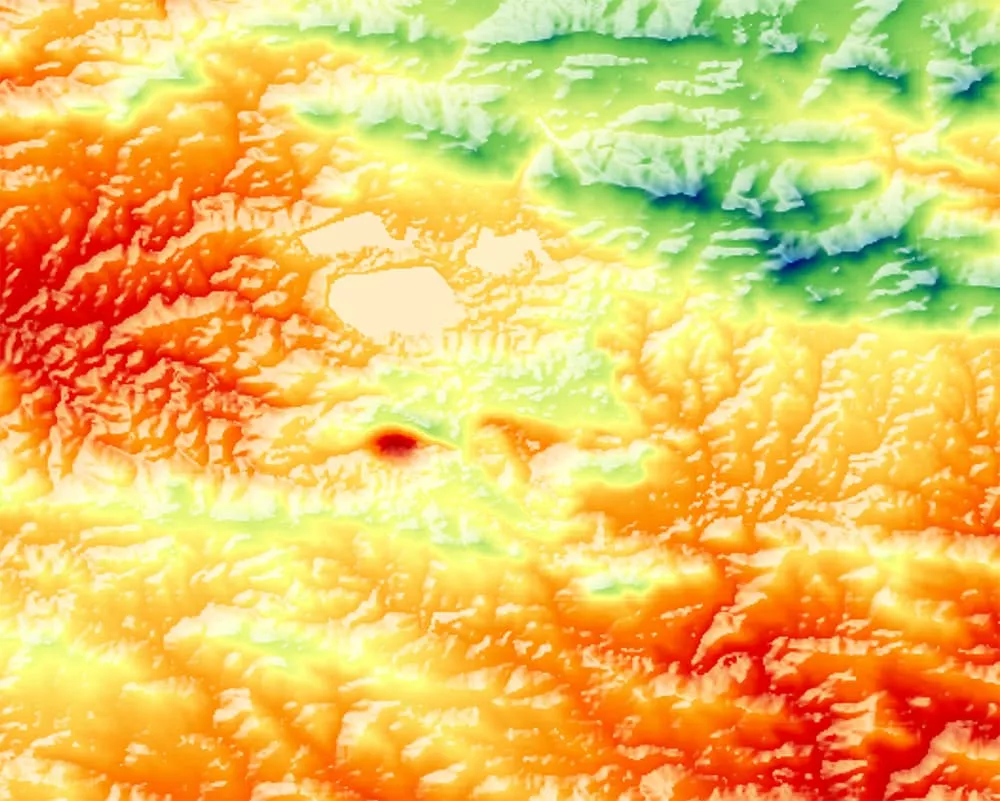
Copernicus DEM and derived slope/flow layers help understand how terrain influences the expansion of dumps or tailings areas. Copernicus Land Monitoring Service products and Sentinel-2 vegetation indices help distinguish active waste-placement areas from rehabilitated/revegetated surfaces.
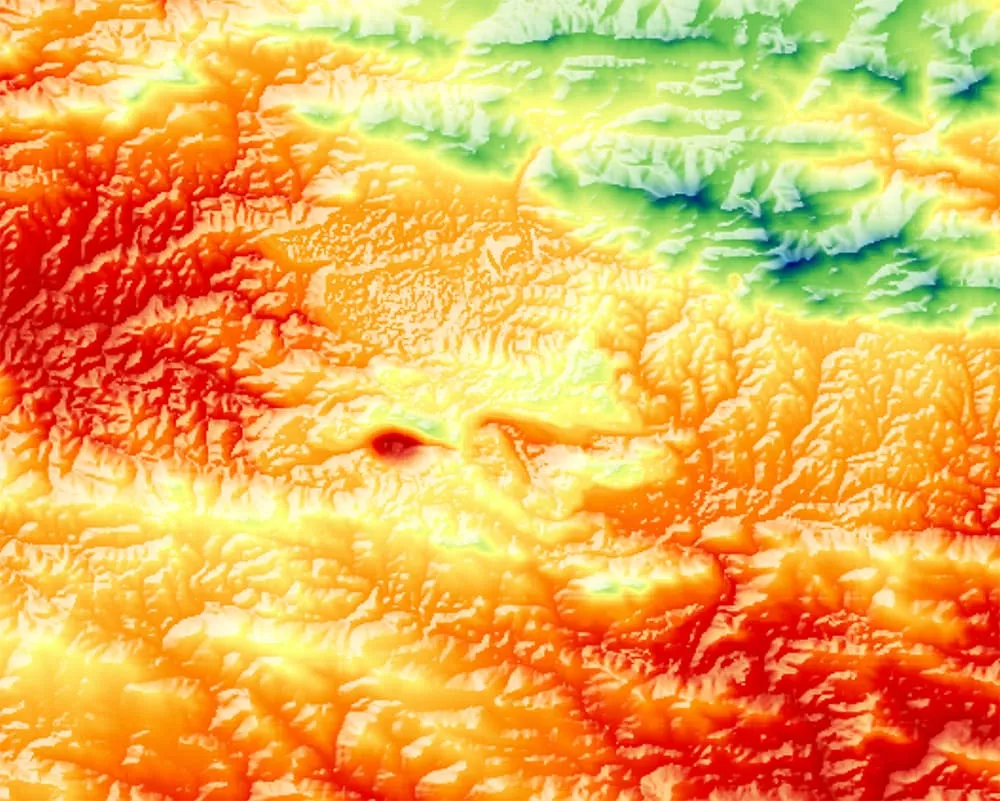
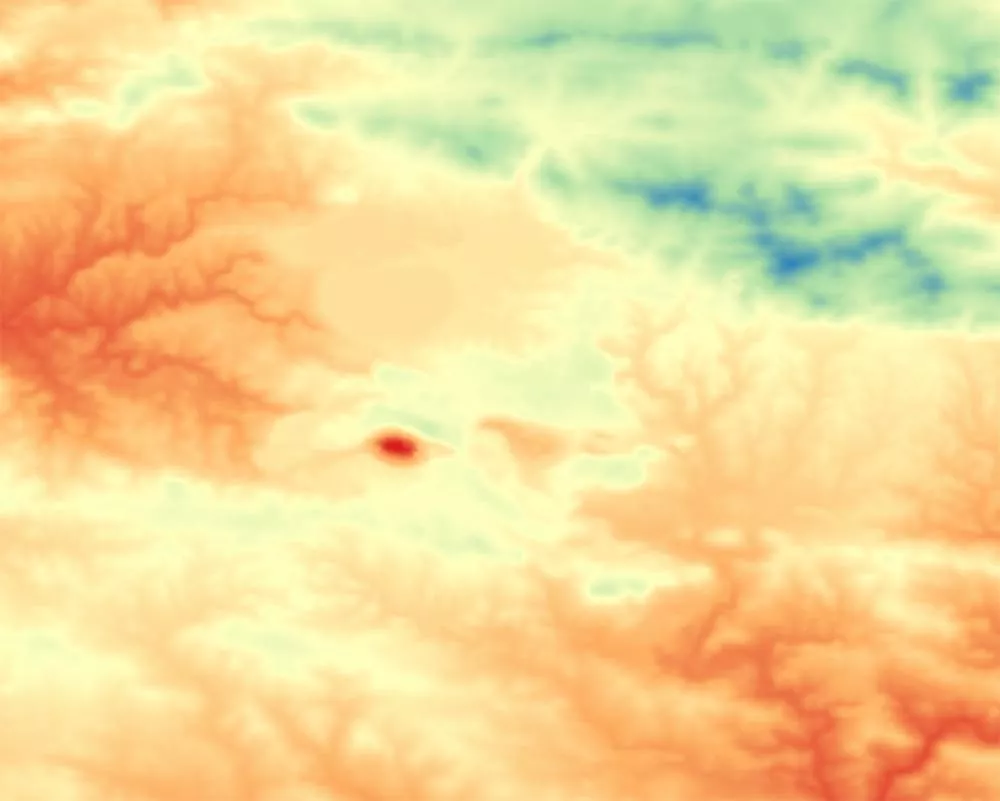
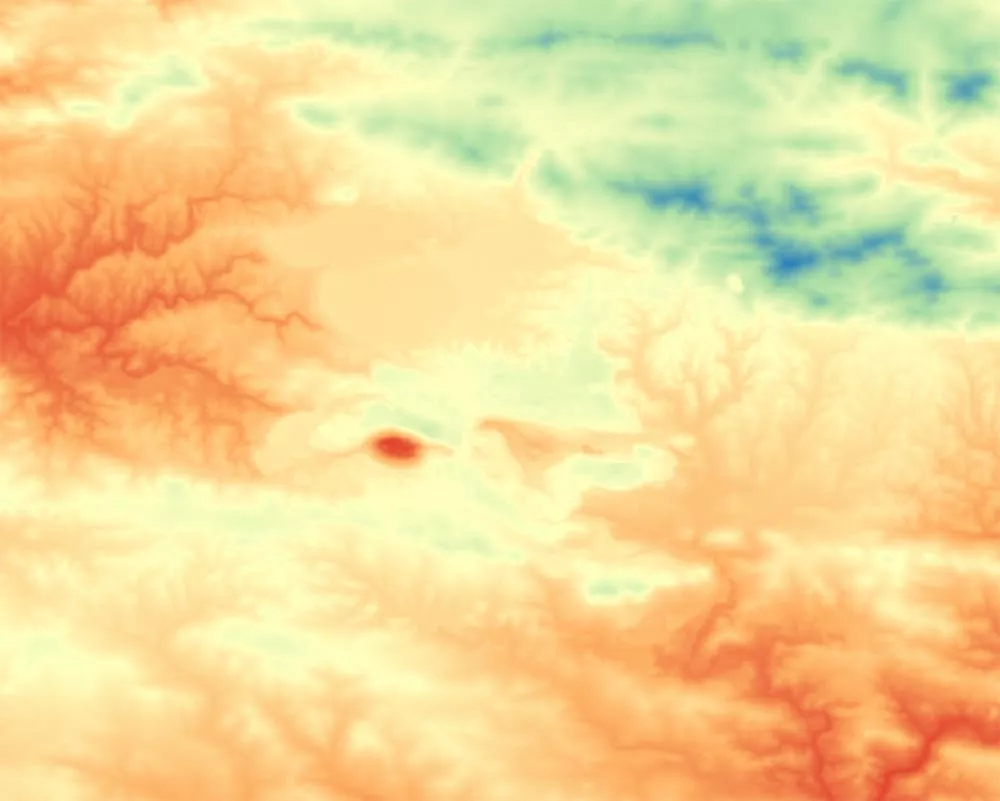
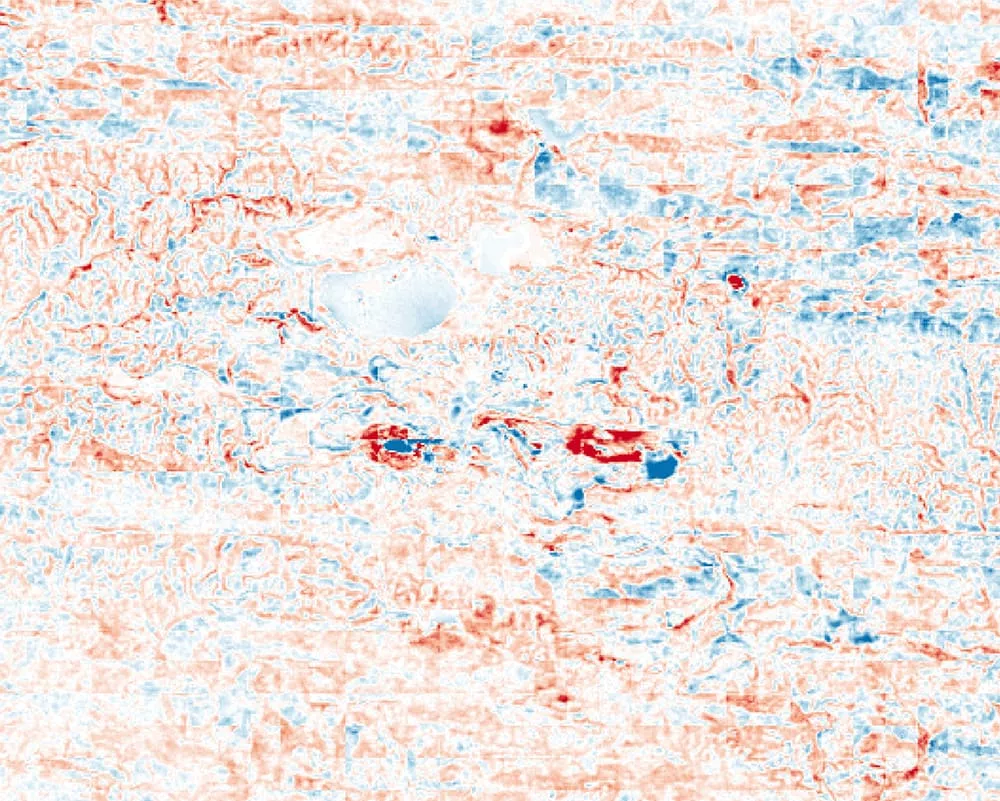
Finally, the European Ground Motion Service (EGMS) can highlight via Sentinel-1 data the slow deformation or subsidence on dam walls, waste dumps or surrounding ground. Although this does not measure volume, it can add a valuable "stability context" alongside volume/footprint changes.
Change over time
Differently from a time snapshot showcasing conditions on a single date, a time series shows whether change is steady, accelerating, or slowing. This is crucial for capacity planning: "When will we hit 80% capacity?"
Through Copernicus Sentinel 1 and 2, EO service providers can build time series on footprint area (e.g., rate of expansion) or activity indicators (e.g., active/inactive zones). In alignment with periodic high-accuracy elevation surveys, Copernicus helps manage filling rates between surveys and flag potential anomalies.
Dashboards can translate this into a "capacity outlook": for example, estimated time to reach defined thresholds (e.g., 70/80/90% of permitted capacity) under current filling rates.
Footprint capacity outlook — Aitik mine
Observed area + projection at current fill rate vs capacity thresholds
Source: Copernicus S2 (illustrative capacity)
Who benefits
from Copernicus?
Through Copernicus data and services, stakeholders can benefit from a consistent and auditable view of how waste facilities are evolving and a clearer line of sight on where to intervene first. For a Mine Waste/TSF Manager, the value of Copernicus can be summarised in three practical benefits:
Earlier identification of fast-changing facilities
• With Copernicus: the manager can check all relevant dumps, stockpiles and TSF cells on a repeated basis and identify where visible change is happening fastest
• Without Copernicus: the operator depends more heavily on intermittent detailed surveys and may only detect an issue once the next campaign takes place
More selective use of detailed surveys and external expertise
• With Copernicus: EO helps indicate which facilities should be prioritised for detailed surveys (e.g., UAV, GNSS, LiDAR) so those resources can be used where they add the most value
• Without Copernicus: the operator is more likely to survey too broadly, increasing cost and reliance on external know-how, or to survey too late, reducing planning flexibility
Stronger evidence for planning, permitting and reporting
• With Copernicus: the manager has dated, map-based repeatable records showing which facilities changed, where it occurred, and how it evolved over time
• Without Copernicus: evidence is more fragmented, making it harder to justify why a facility was prioritised, why a follow-up survey was commissioned, or when a trend first became visible
Taken together, these benefits make the monitoring workflow more proactive. Copernicus does not replace detailed volume surveys, but it helps the operator use them more intelligently: earlier where needed, less broadly where not needed, and with a clearer rationale for why action is being taken.
In summary,
Copernicus enables more proactive, targeted and evidence-based mine monitoring, helping managers detect change earlier, focus detailed surveys where they matter most, and strengthen the evidence base for intervention, planning and reporting.
Explore this
further with us
Copernicus Sentinel data and many Copernicus service products are free and openly available, making it easier to scale monitoring across multiple sites and regions.
EUSPA can support stakeholders by helping identify fit-for-purpose Copernicus datasets, designing meaningful indicators, and connecting with EO service providers to operationalise dashboards, reporting and alerts.