Water quality monitoring
- Raw materials
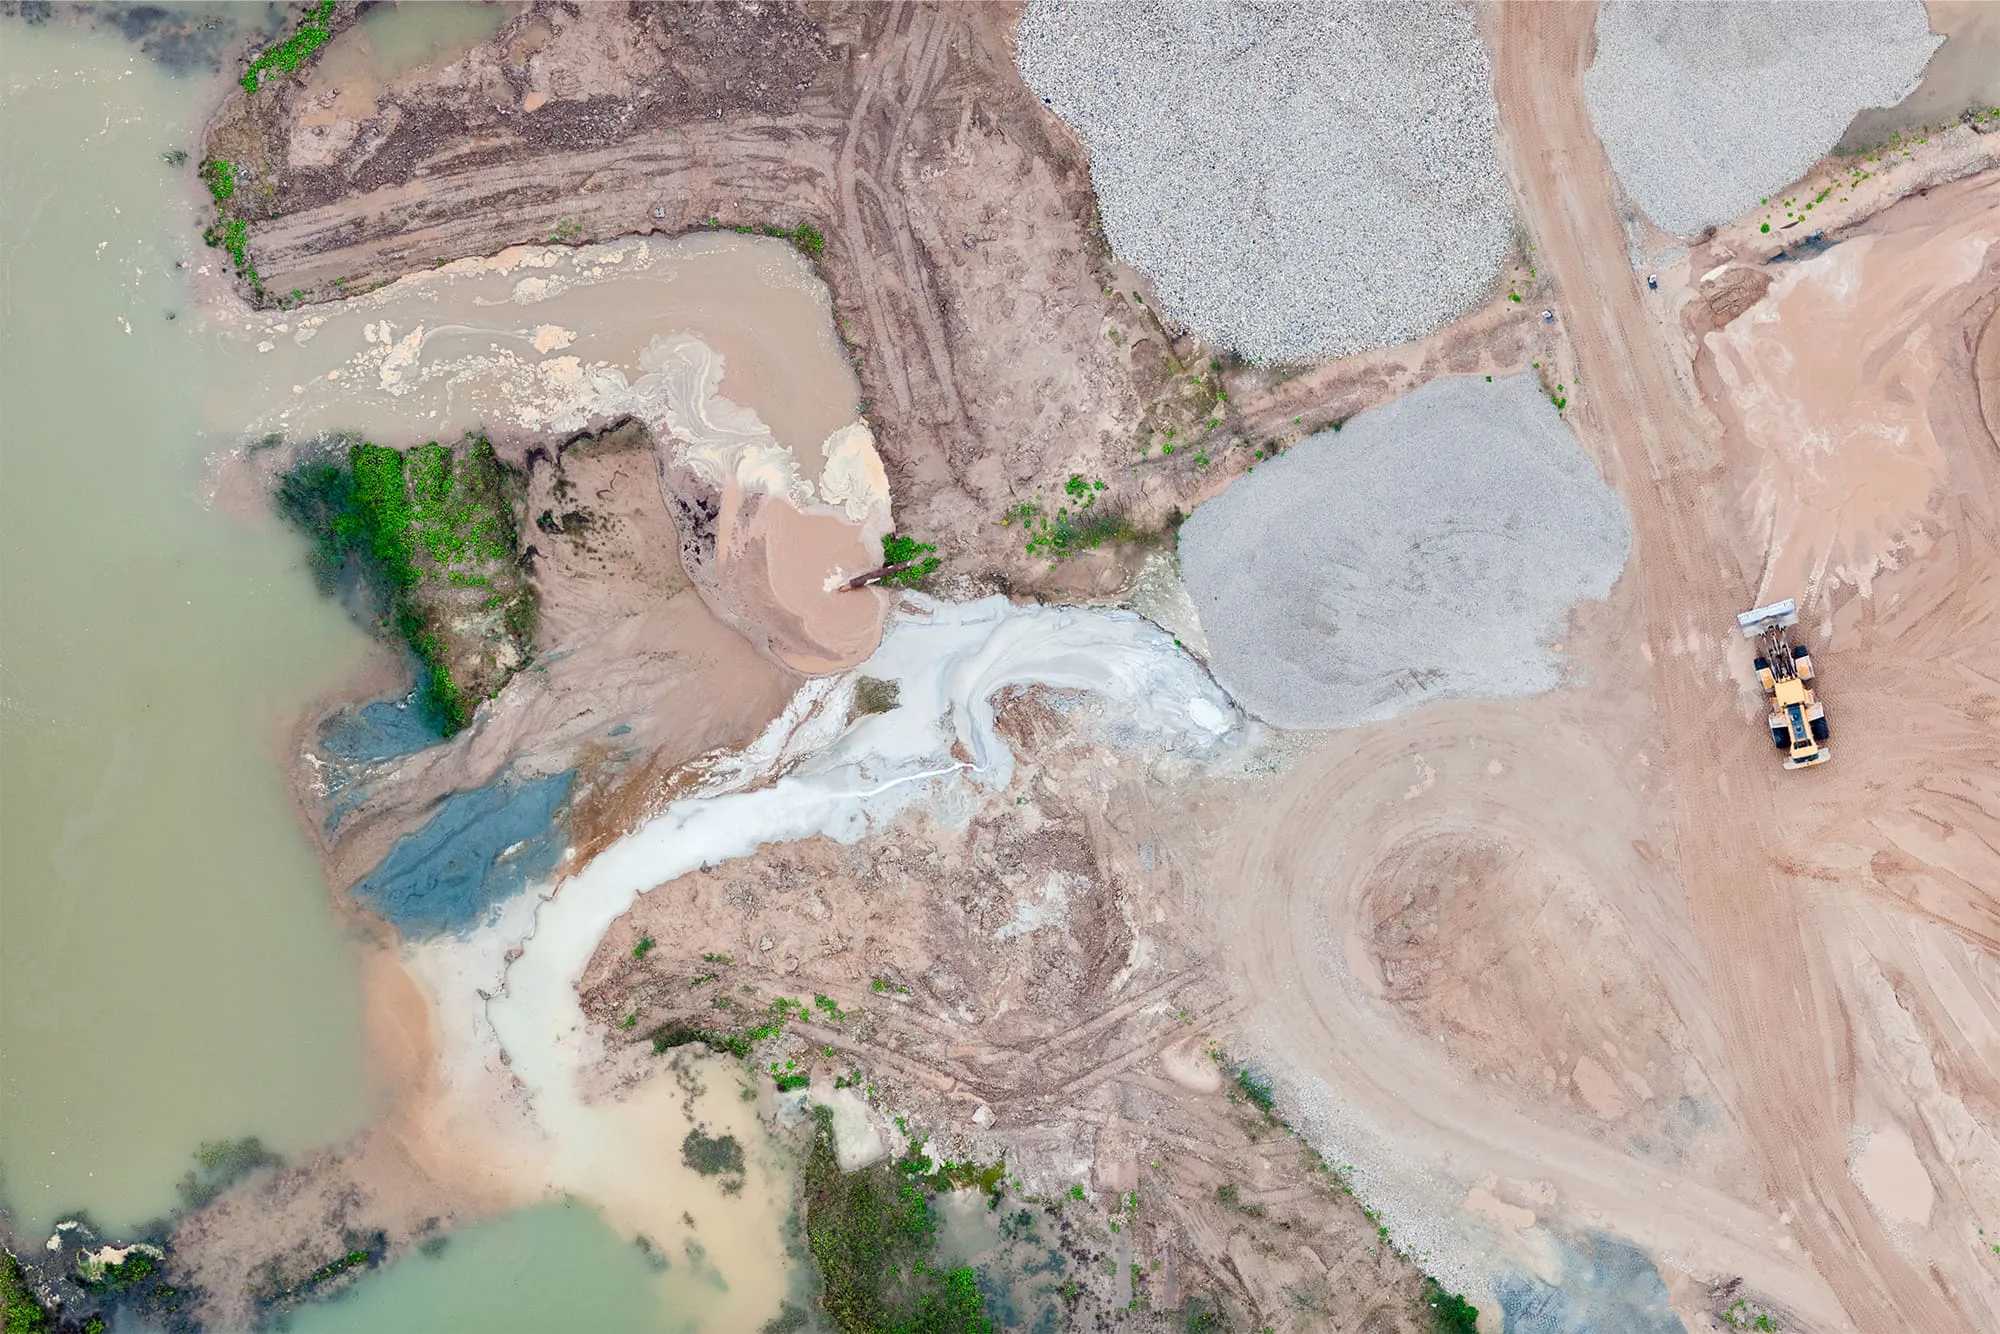
After heavy rainfall, a Mine Environmental Manager has to answer a few urgent questions fast: did the runoff from the site affect nearby rivers or ponds, where did the impact start, how far could it travel, and do we need to act immediately? This is a recurring operational issue.
Almost
-
%
of the EU-27’s groundwater body area is in less-than-good condition because of diffuse pollution from mining.
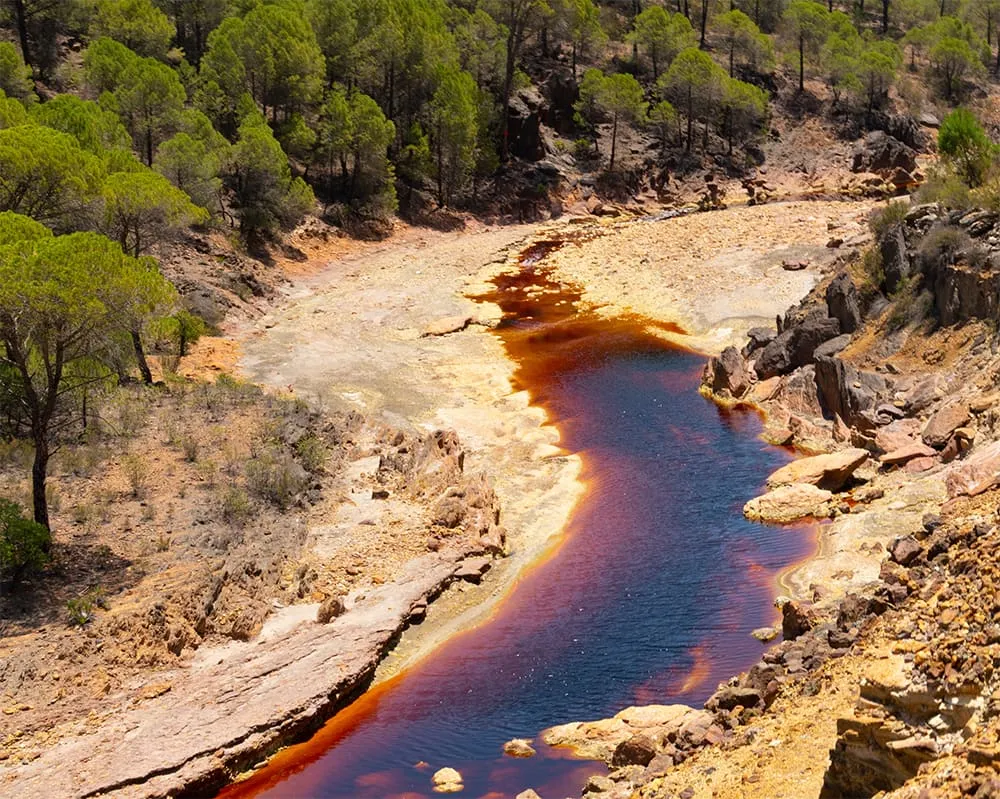
At many mine sites, rainfall over waste rock or tailings materials can trigger chemical reactions, generating acidic runoff. This polluted water may dissolve and transport metals (e.g., iron, copper or lead) into nearby rivers, soil or groundwater. Downstream, this may appear as cloudier water which contaminates ecosystems, drinking water and surrounding farmland. If not properly managed, these impacts can persist for decades and extend well beyond the immediate mine site.
For Mining professionals, this is not only an environmental issue, but also a compliance, operational and reputational issue. Indeed, Mine Environmental Managers must ensure that permit conditions are respected, ESG commitments are supported with evidence, and any potential impact is identified early enough to avoid escalation.
Why this matters
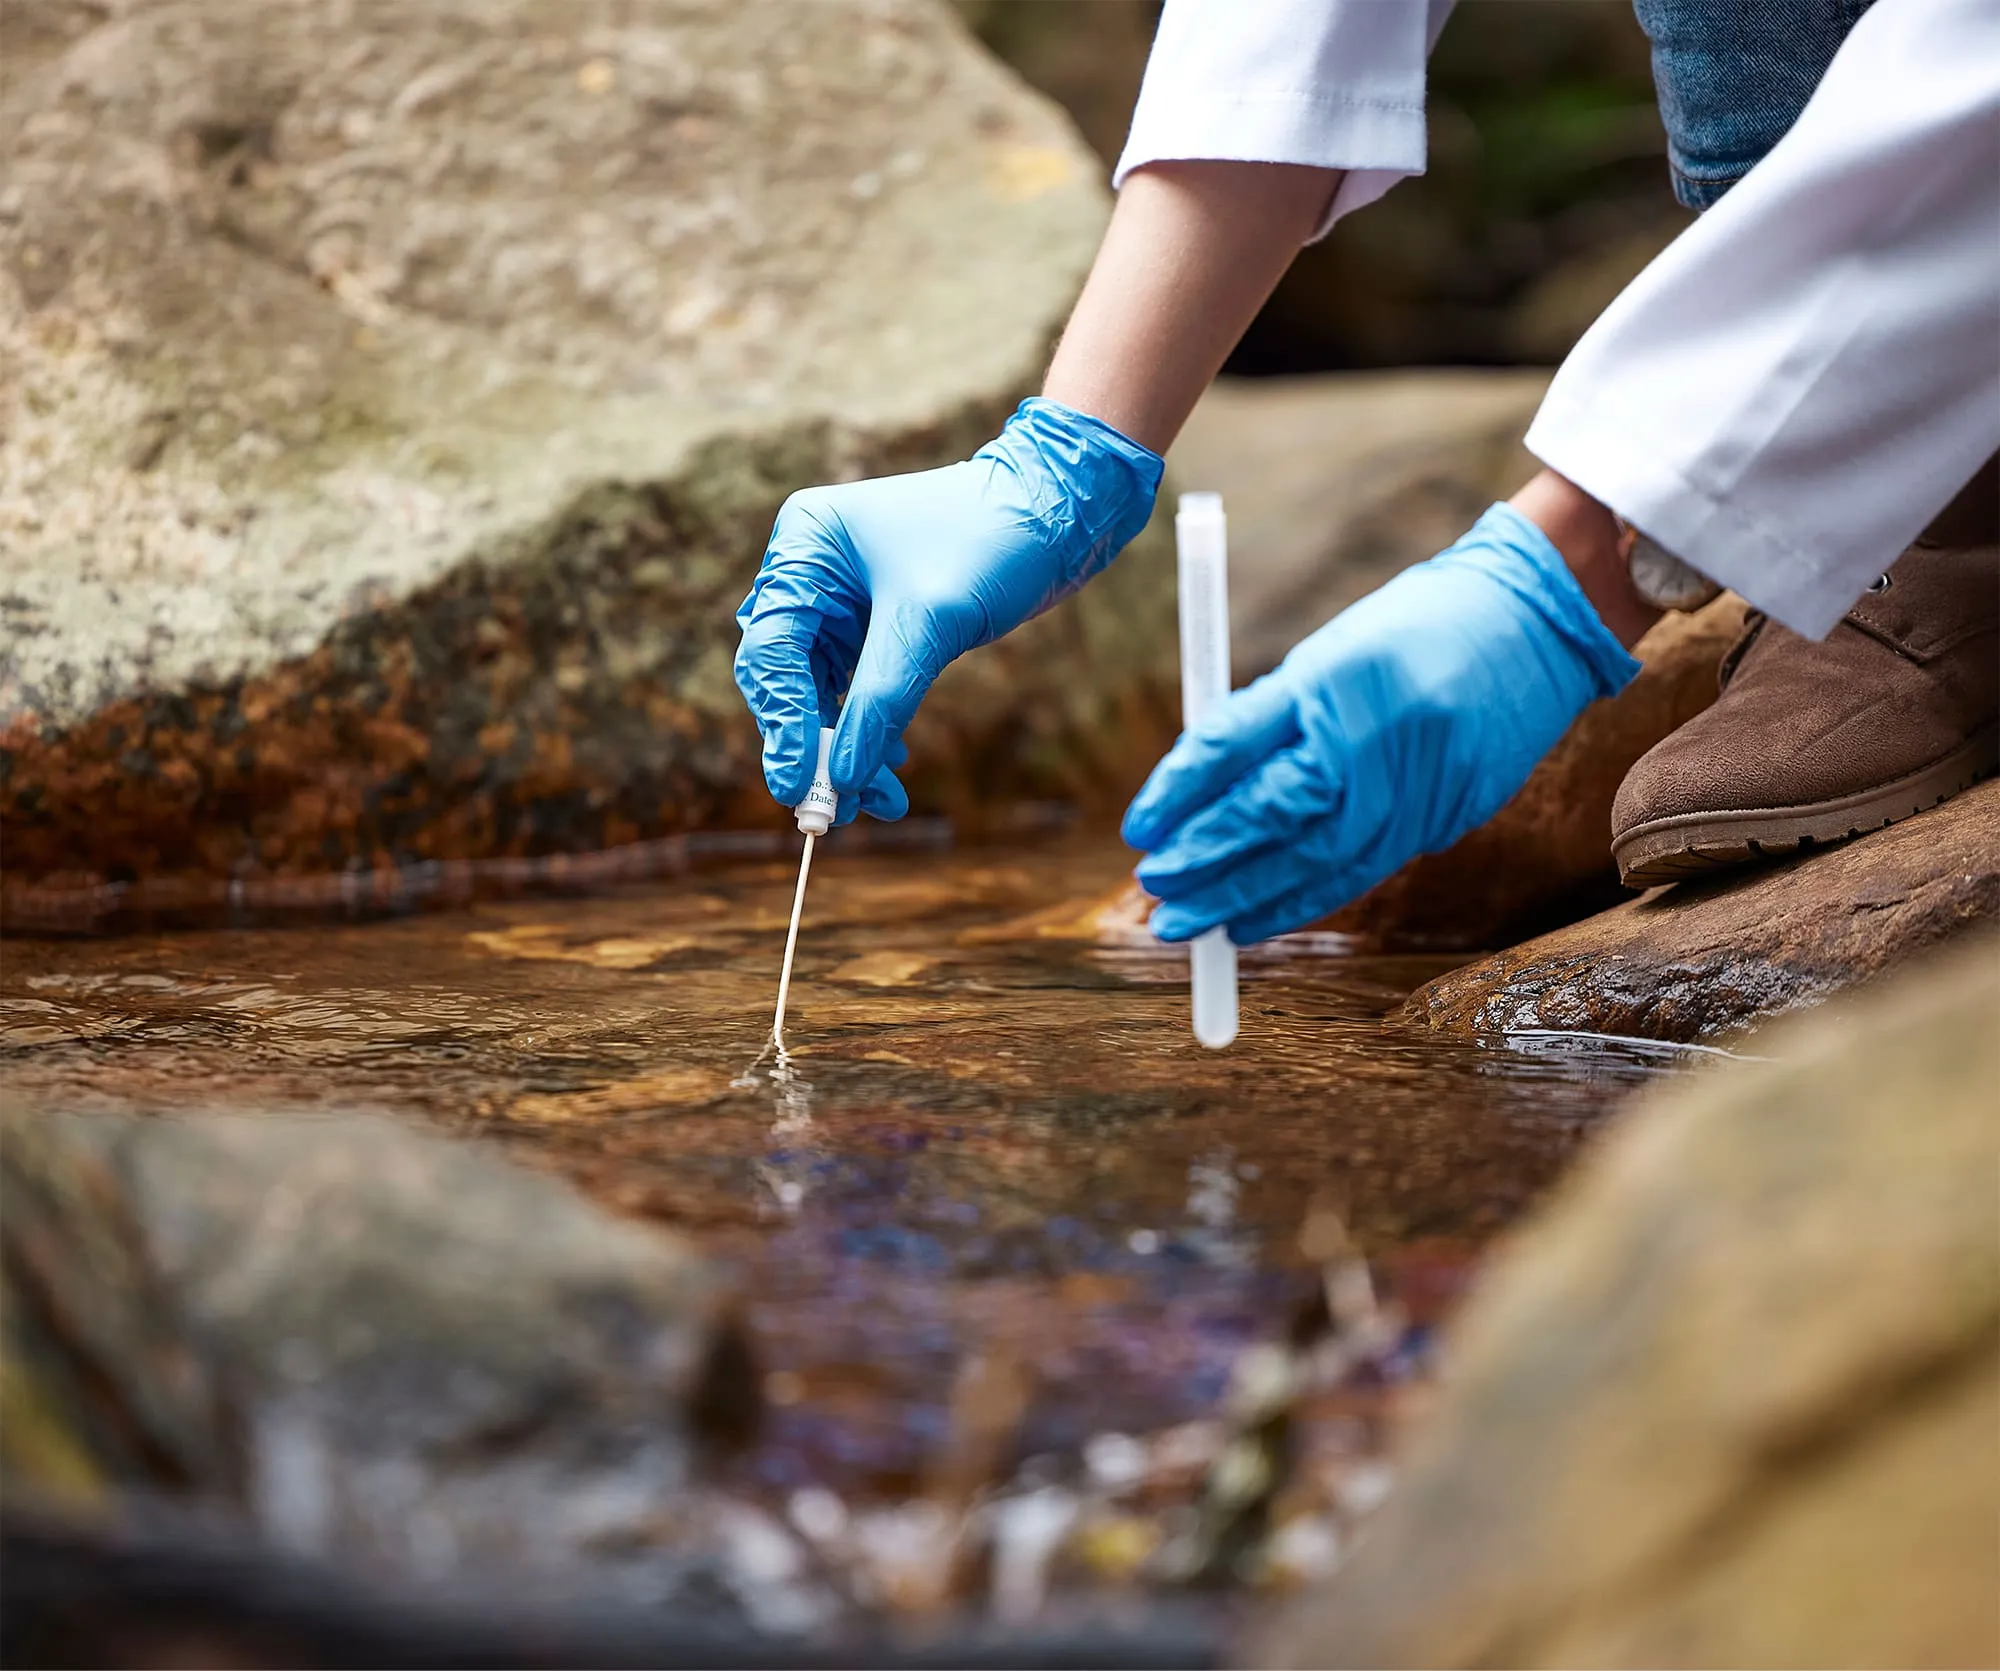
The conventional approach to water quality monitoring can be too slow and too localised to support fast operational decisions. In-situ samplings, site visits and laboratory analysis remain essential, but they only show conditions at specific points and moments in time. If a storm affects a wide area, the team may need to inspect many locations before understanding where the issue began and which water bodies downstream are most at risk. This translates into more time in the field, more sampling costs, and the risk of discovering the problem too late.
For Environmental managers, late detection can translate into higher remediation costs, operational disruption and pressure from regulators, communities and investors.
European examples
Real examples show that the financial implications can be significant: in Sweden, Viscaria reported in 2024 about EUR 15.5 million in accumulated investment mainly for permanent water treatment. More broadly, in Finland, Terrafame stated that decisions concerning its environmental and water permit led to extraction restrictions and the suspension of mining operations at the end of 2024, with significant additional costs, illustrating how water- and environment-related permitting constraints can become operationally critical.
In Finland,
an 8-year study
showed treated effluent from the Kittilä gold mine impacted water quality up to 7 km downstream in the Seurujoki River.
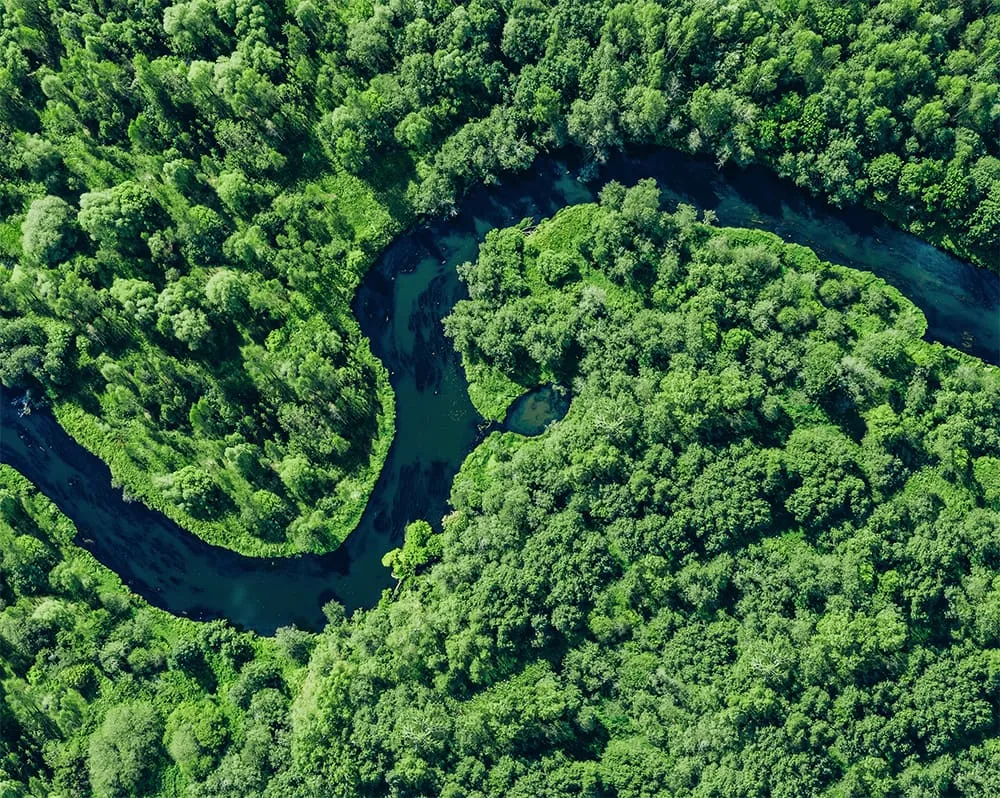
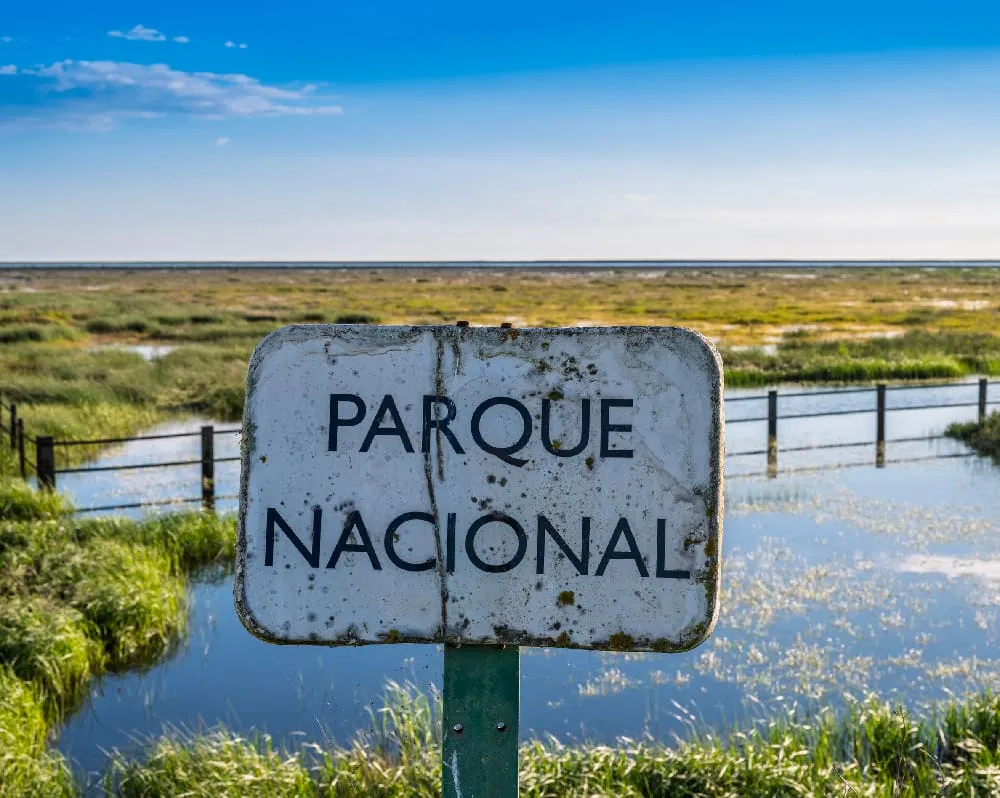
Mining-related water pollution in Europe is not only about rare disasters. It can also come from routine operations, where impacts may be seen as higher pollutant levels several kilometres downstream (Seurujoki River case), or as slow accumulation of metals over many years in rivers and estuaries (Guadalquivir Estuary case).
In Spain’s
Guadalquivir estuary,
a 2-year monitoring campaign
found metal contamination in a mining district active since 2009.
Mining-related water pollution in Europe is not only about rare disasters. It can also come from routine operations, where impacts may be seen as higher pollutant levels several kilometres downstream (Seurujoki River case), or as slow accumulation of metals over many years in rivers and estuaries (Guadalquivir Estuary case).
Copernicus can help
This is where Copernicus, the EU’s Earth observation programme, can help by providing:
- a screening layer for detecting visible changes in surface-water conditions
- regular, wide-area observations to track how those changes evolve over time
- support for identifying potential hotspots and prioritising where field teams should focus first
Rather than replacing in-situ monitoring, Copernicus strengthens it by helping the mine environmental manager target fieldwork more efficiently and build a clearer picture of where visible anomalies may be emerging.
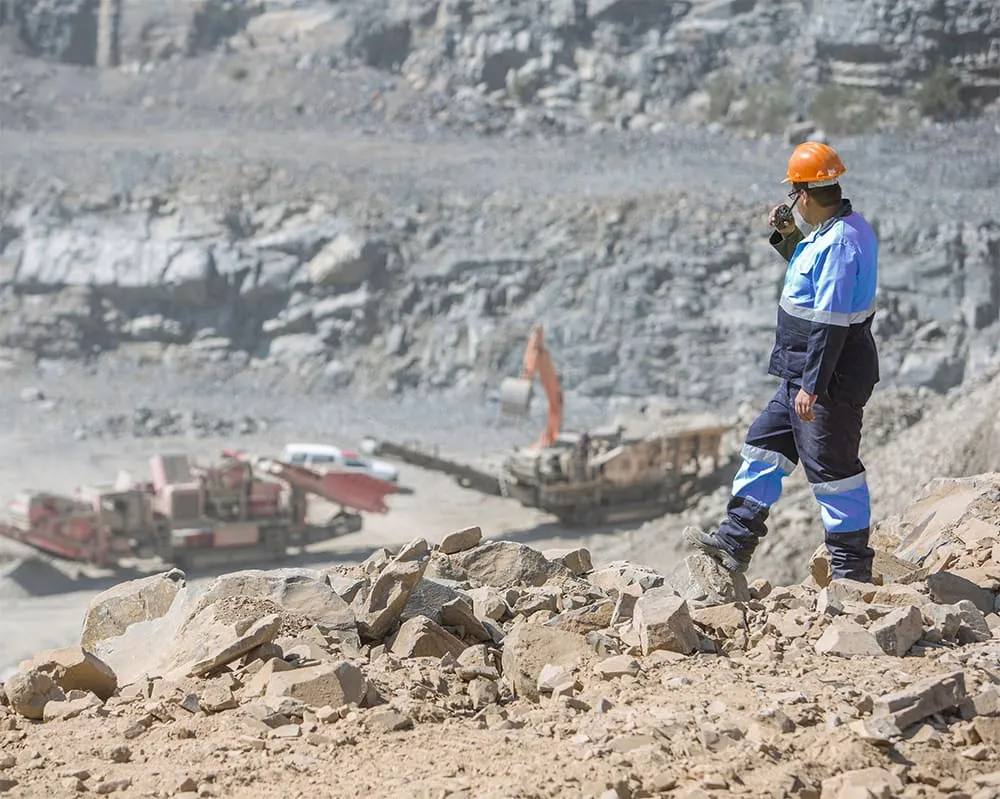
In practical terms, this means that after storms, heavy rainfall or other weather-related events, the mine environmental manager can rapidly review satellite-based evidence to check whether sediments flow appears downstream, whether it is spreading, and which locations are most relevant for targeted field verification. Instead of sending teams to 15–20 possible sampling points, the company may be able to prioritise only the 3–5 most relevant locations. That can save time, reduce the costs of unnecessary field effort, and produce a clearer audit trail for internal decision-making and external reporting.
Surface-water quality proxies
To zoom in on one practical use case, Copernicus can support the screening of possible surface-water quality changes around mine sites.
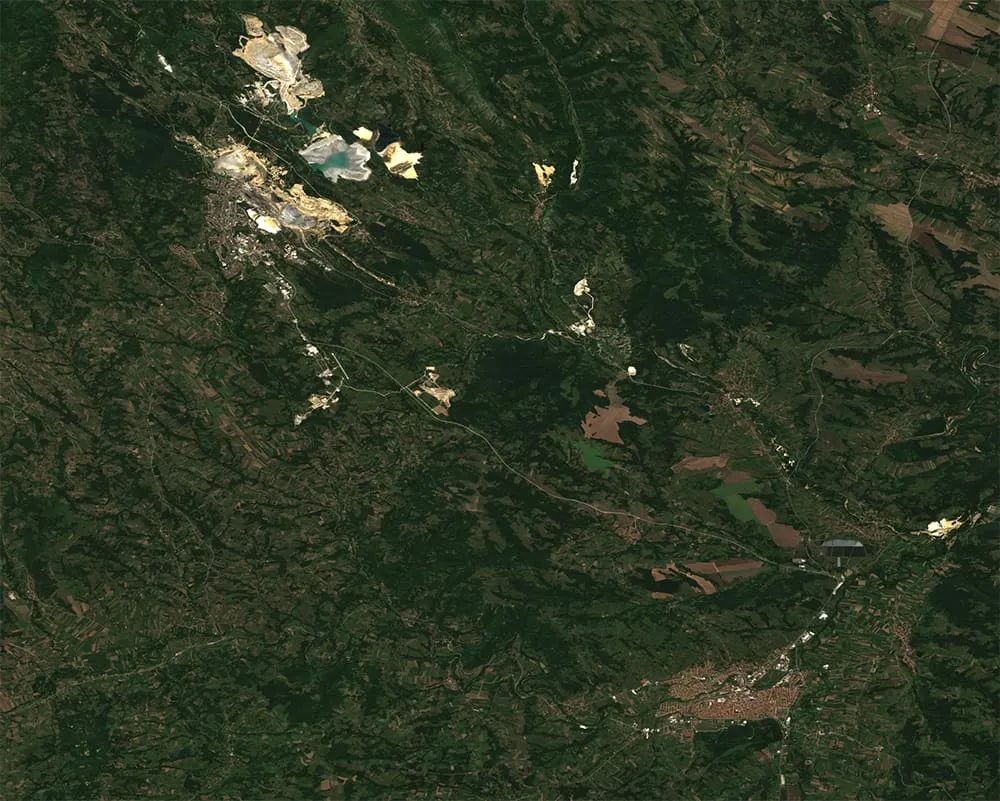
Copernicus Sentinel-2 is particularly useful here as it provides multi-spectral imagery with 5 days revisit time. This enables to detect changes in water colour and clarity in rivers, lakes and tailing ponds over time. Water turbidity can be estimated using the Normalized Difference Turbidity Index (NDTI), which highlights how much material is suspended in the water by exploiting reflectance differences between red and green spectral bands. For example, if a downstream point is normally low but rises after rainfall, while upstream reference points stay stable, this may be a sign that sediments have been mobilised from the site and that targeted checks are needed.
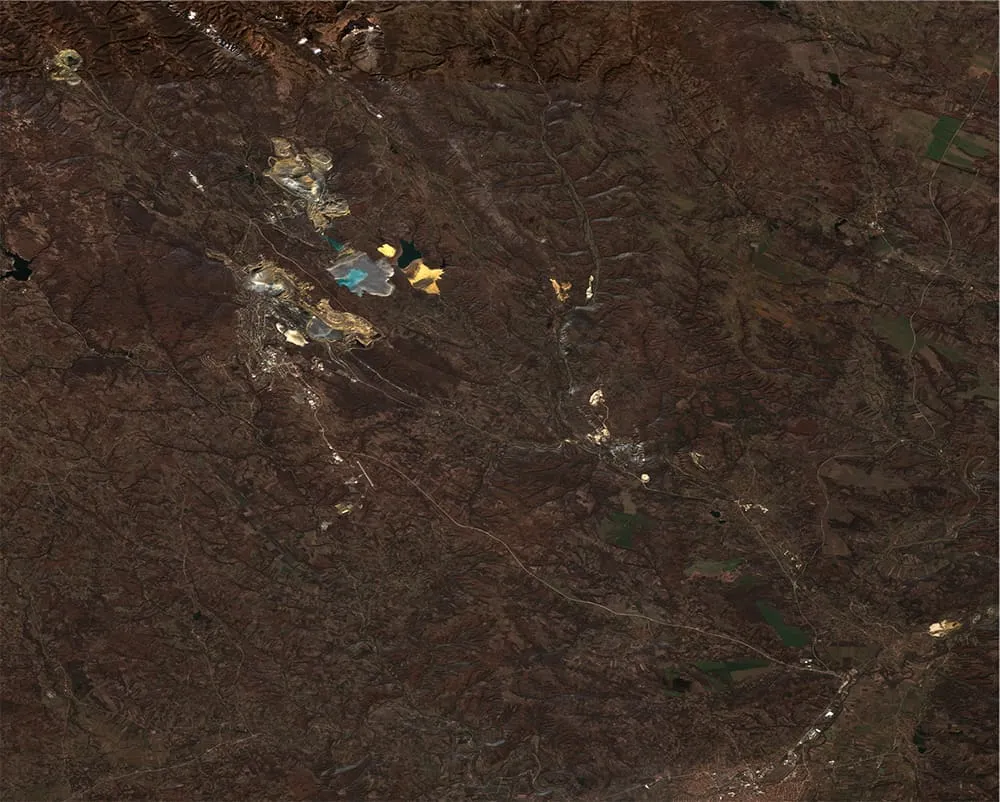
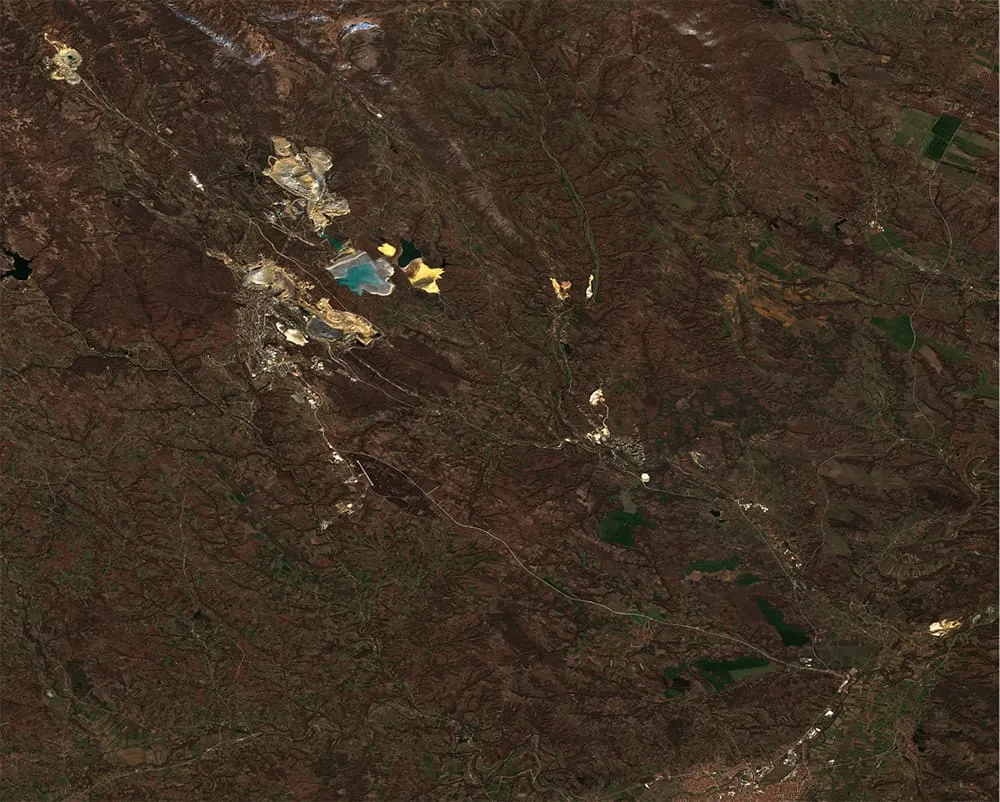
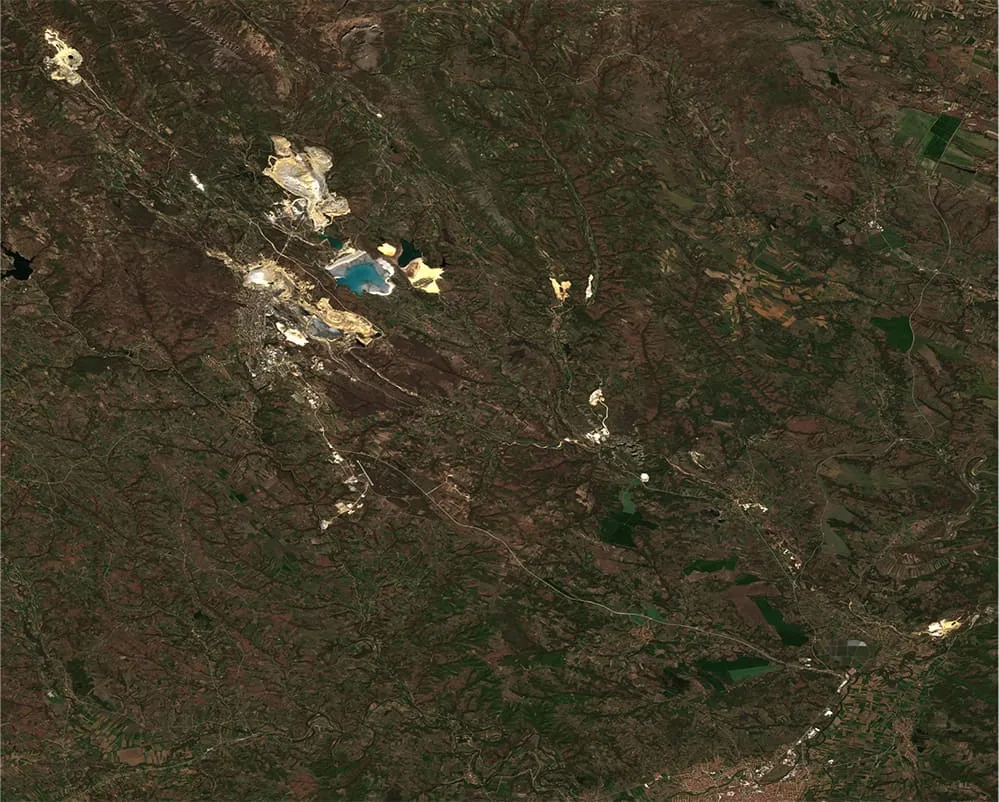
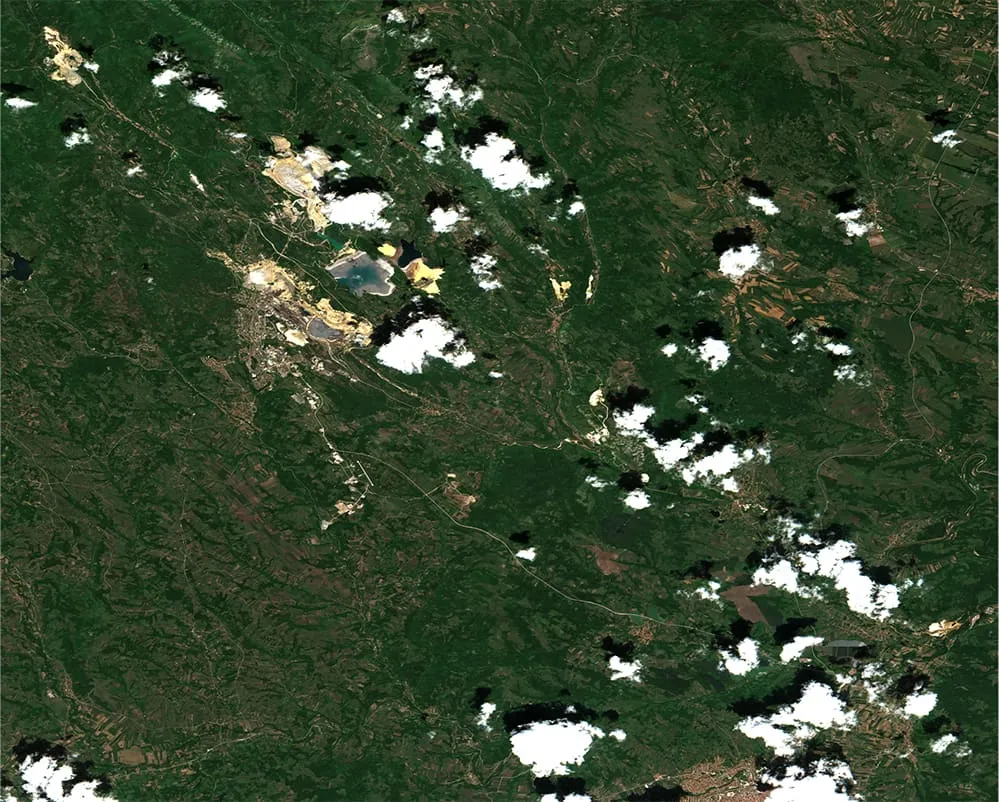
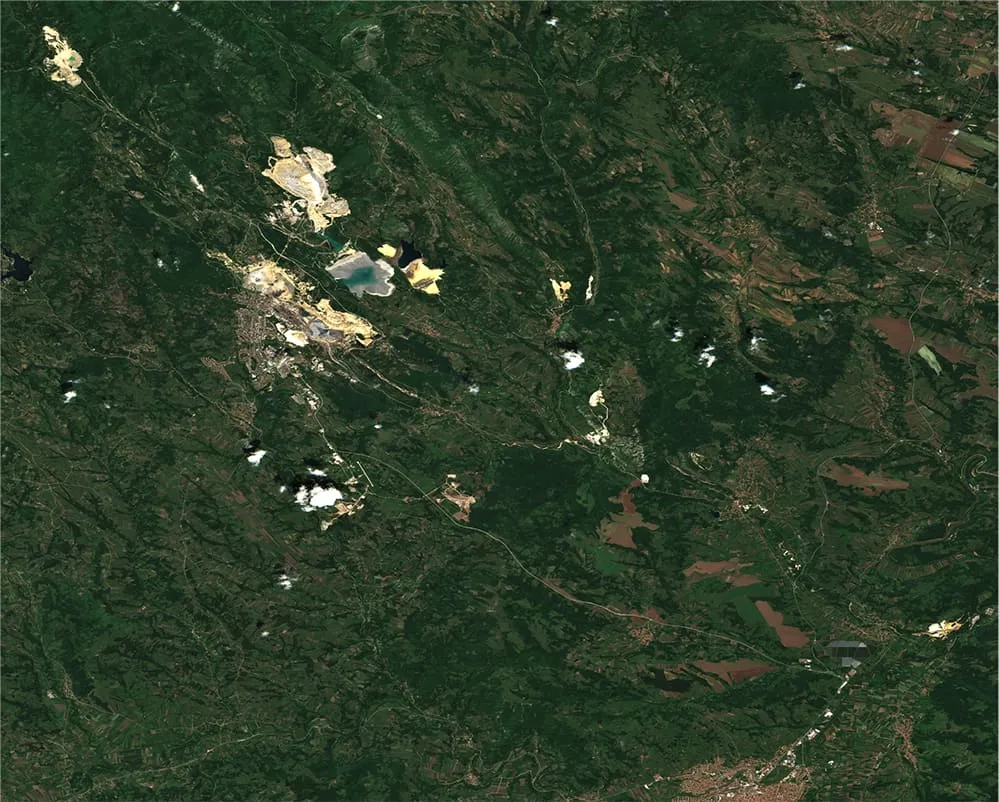
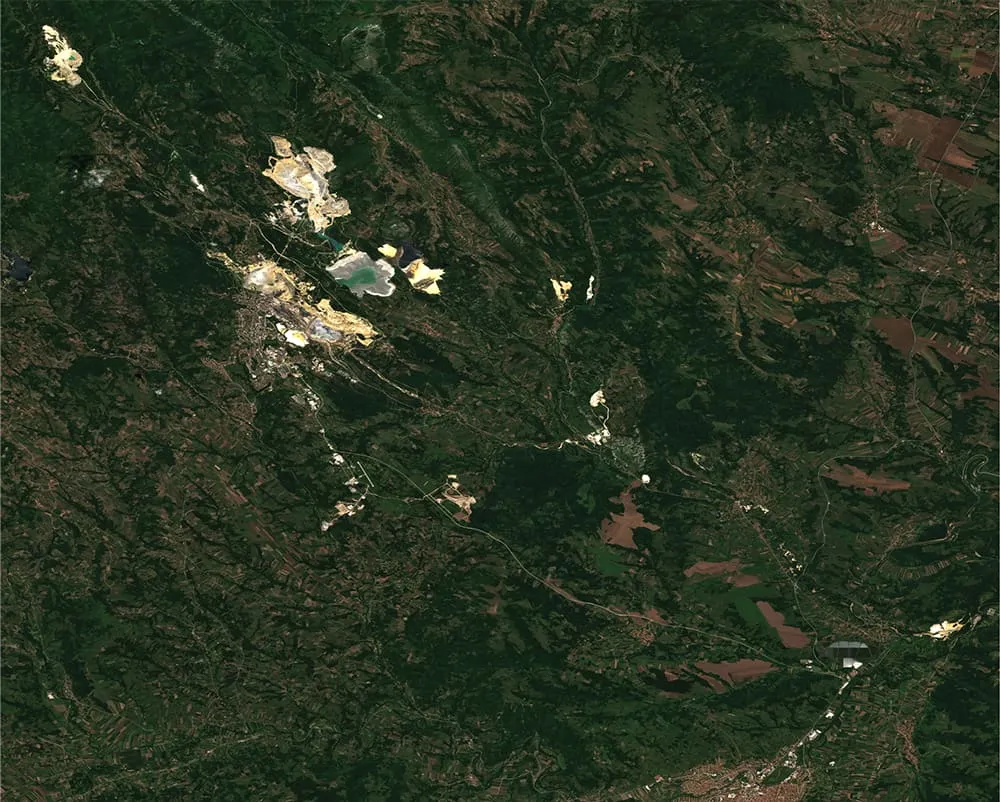
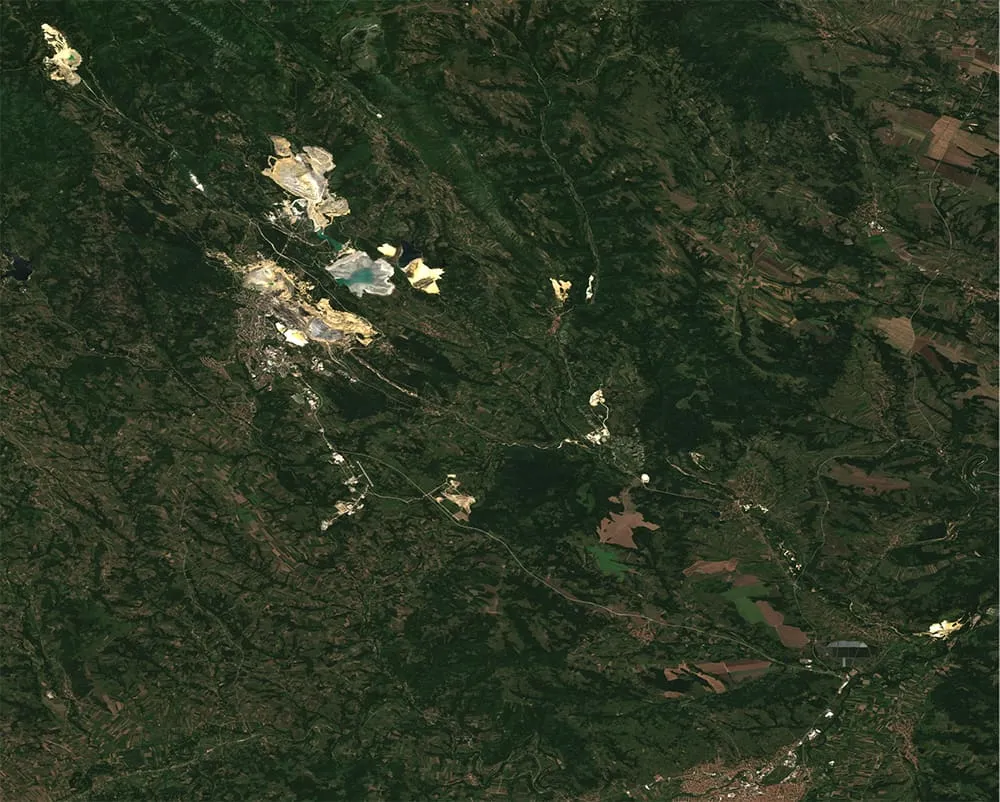
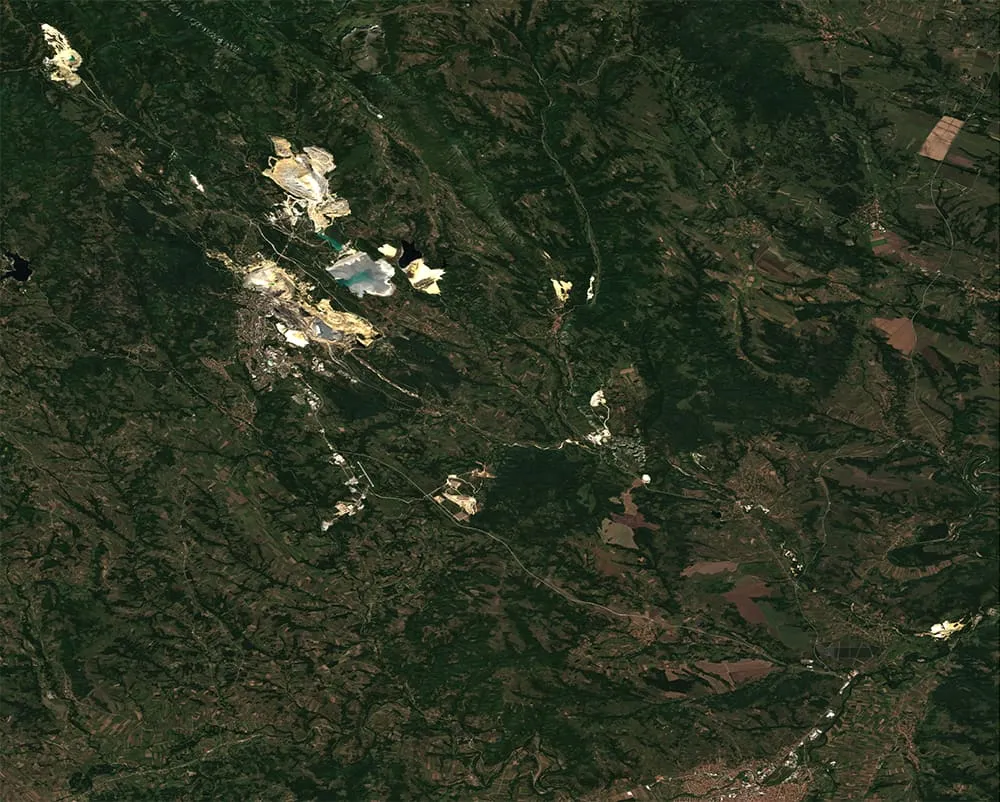
Copernicus cannot directly measure dissolved contaminants such as dissolved metals. However, it is very valuable for detecting visible water-quality impacts, tracking sediments extent and movement, and guiding targeted in-situ sampling. In that sense, it acts as the first-level screening layer: in practice, the image shows how before heavy rainfall water appears stable, while after rainfall EO data show increased turbidity and sediment plumes, indicating where in-situ checks are needed.
In practice, for auditable indicators (e.g., turbidity proxy time series), additional processing is typically required. This processing can be performed by EO service providers to deliver ready‑to‑use maps, alerts and dashboards.

Drivers and pathways
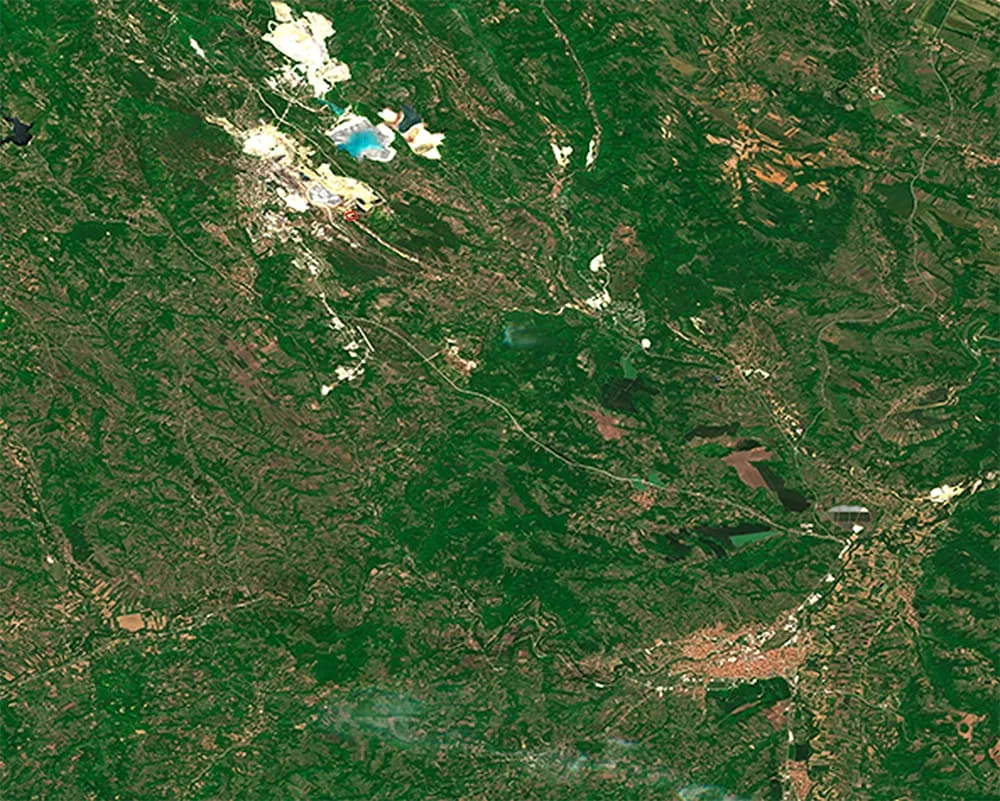
Copernicus Land Monitoring Service (CLMS) land-cover layers at 10 m resolution, updated annually, provide a consistent picture of how the landscape is used and how it evolves over time. These datasets allow stakeholders to identify areas prone to sediment generation, such as bare soil, construction zones, or sparsely vegetated surfaces, including active mining areas (e.g., open pits, waste dumps, and tailings facilities) where large volumes of soil and rock are regularly disturbed and exposed, and distinguish them from stable, well-vegetated land covers that reduce erosion risk.
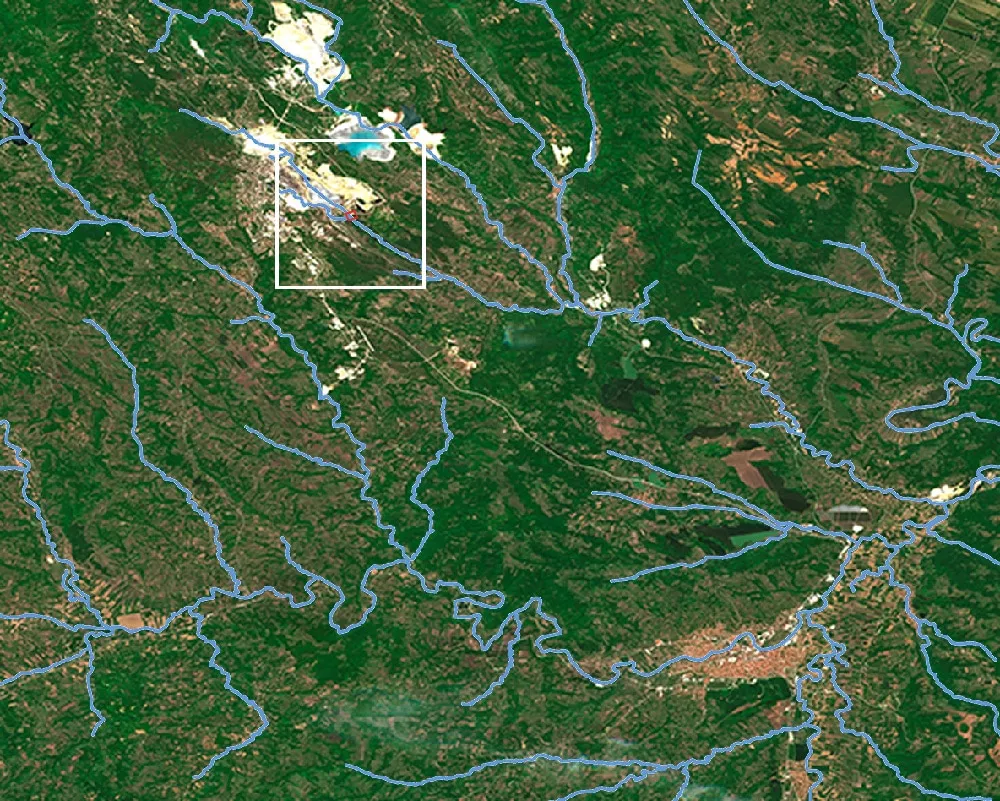
In the image, the red box marks the discharge point where mine tailings enter the river, representing the interface between the waste dump and the natural stream channel.
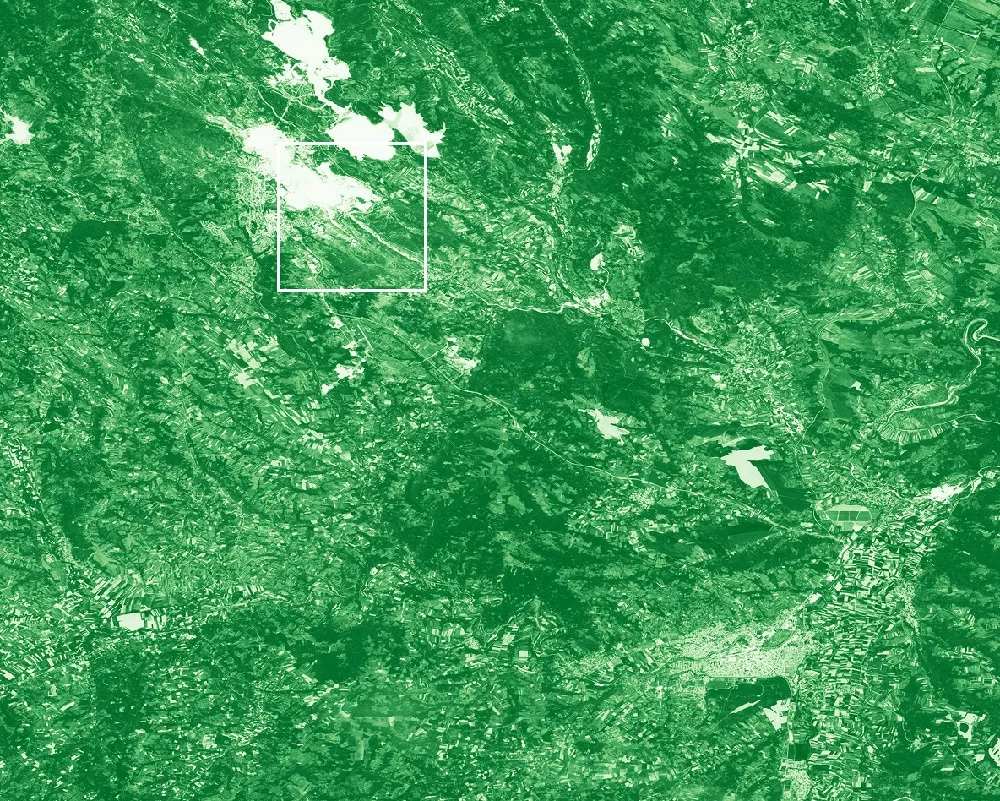
To understand why a turbidity signal appears, Sentinel-2 vegetation indices and Copernicus land-cover layers can help distinguish disturbed/bare ground (e.g., exposed soil, waste-rock areas) from vegetated areas, and track changes over time (e.g., rehabilitation progress).
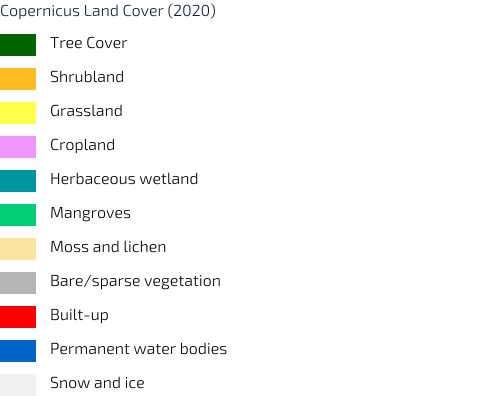
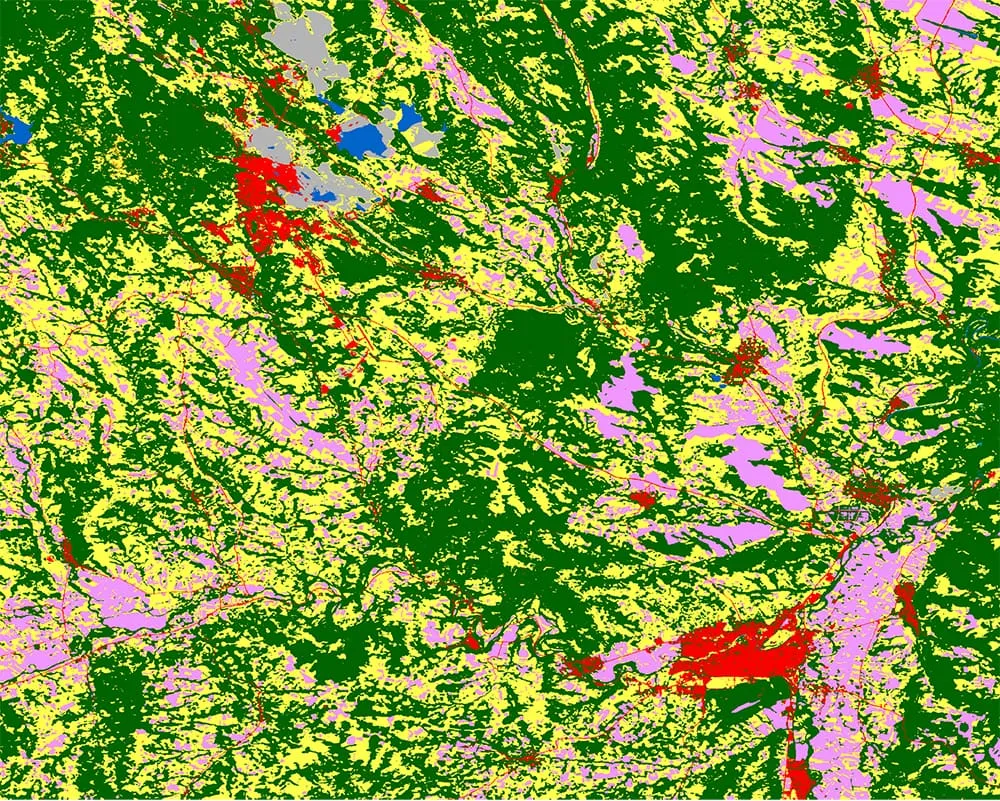
Copernicus DEM (Digital Elevation model) and the EU-Hydro river network dataset can provide context information on the terrain (e.g., slope and drainage information) to map likely runoff and sediment transport pathways. This helps stakeholders trace where sediments may be entering the drainage network and which downstream receptors could be affected.
Change over time
A single map shows conditions on one date. A time series shows how water quality evolves, when anomalies occur, and whether an issue is event-driven (e.g., storm spikes) or persistent (e.g., increasing baseline turbidity).
By using the 5-day revisit frequency of Sentinel-2, it is possible to extract the Normalized Difference Turbidity Index (NDTI) for a chosen downstream control point and plot it over time. Combining it with precipitation data can help distinguish rainfall-driven events from potential operational issues.
This supports earlier detection of water pollution risks, better-targeted field inspections, and clear evidence for permit reporting.
Bor mine surroundings - Serbia
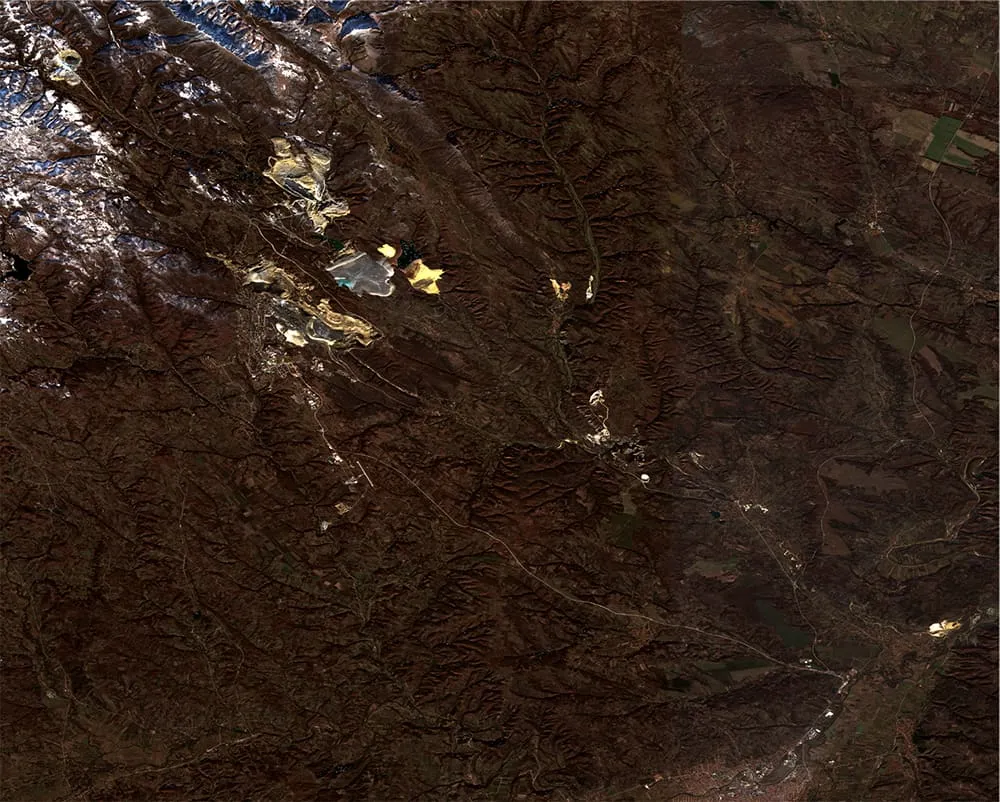
Sentinel-2 time series enable continuous, large-scale monitoring of river systems around the Bor mine, helping detect anomalies, seasonal patterns, and potential degradation sources, even with limited in-situ data.
Temporal variability
The plot shows the temporal variability of NDTI for a fixed river segment downstream of the Bor mine. In general, NDTI values below 0 indicate clear water, while in this graph the values are mostly between 0 and 0.1, suggesting the presence of some sediment. On certain days, however, NDTI exceeds 0.1, indicating moderate turbidity and sediment presence
Who benefits
from Copernicus?
For a mine environmental manager, the value of Copernicus can be summarised in three clear benefits:
Faster screening after rainfall or incidents
With Copernicus: the team can identify where anomalies are occurring and build a first picture of possible downstream impacts. This allows for a swift selection of sampling locations.
Without Copernicus: the sampling locations are less certain, requiring a larger number of sites to be covered. This increases both the preparation time and the risk of a delayed response.
More targeted and cost-effective in-situ monitoring
With Copernicus: swift satellite-enabled screening of sampling locations enables efficient, evidence-based inspections, reducing unnecessary site visits and associated costs.
Without Copernicus: sampling plans are broader, slower, and more expensive due to limited initial information regarding where the issue began and how far it spread.
Stronger evidence for compliance, ESG and stakeholder communication
With Copernicus: mining professionals can support decisions with up-to-date, map-based evidence showing the location, extent, and evolution of visible impacts.
Without Copernicus: the evidence base relies on scattered field observations, making reporting less clear and complicates discussions with regulators, communities, and investors.
In summary,
in business terms this can mean time saved during post-event response, better prioritisation of laboratory testing, and lower risk of avoidable remediation or compliance costs. Where the operator uses Copernicus as a screening layer and reserves field work for the most relevant locations, the overall response effort
can become both faster and more effective.
Explore this
further with us
Do you have questions about runoff, sediments, or downstream water-quality impacts? Explore free Copernicus data as a practical first screening layer for your monitoring approach.
EUSPA can help interested stakeholders explore which Copernicus datasets and indicators are most relevant for their operational needs, how they can be turned into dashboards, alerts or reporting tools together with EO service providers.