Flood, drought, and extreme weather assessment for crops
- Agriculture & forestry
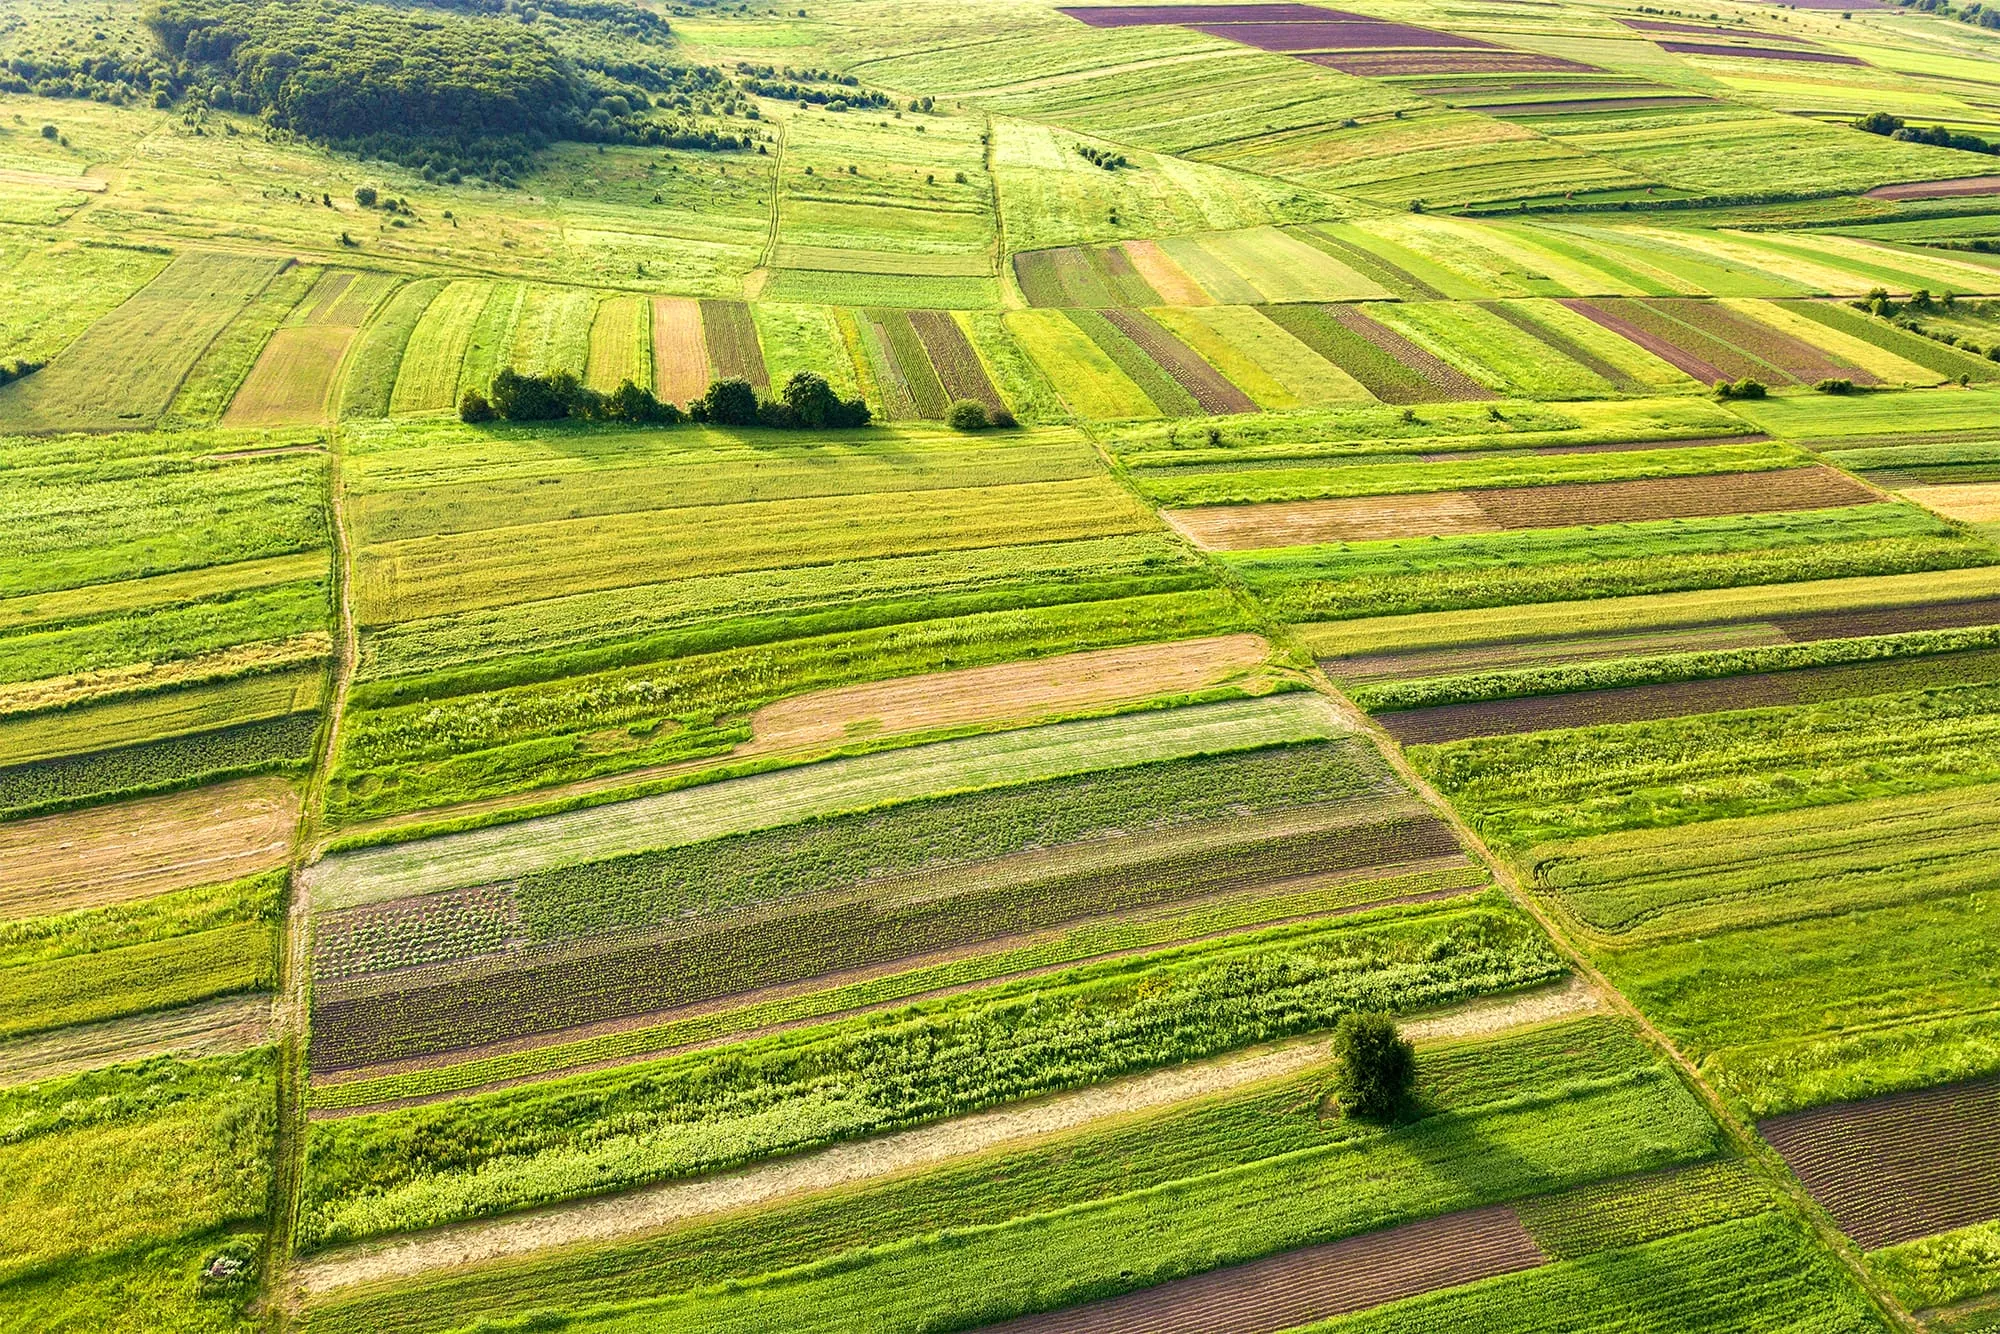
Extreme weather, floods, droughts, and storms, can devastate months of work in hours, leaving crops destroyed and land unusable. Farmers are increasingly at the mercy of a climate that offers less and less warning. After disaster strikes, accurate crop loss assessment is everything, it drives recovery, replanting, and insurance claims.
€
-
billion
EU agricultural sector losses from the effects
of extreme weather each year
Farmers today face increasing uncertainty as environmental conditions grow more unpredictable and extreme. Floods, droughts, and severe storms can strike with little warning, overwhelming fields that took months of labour and investment to cultivate.
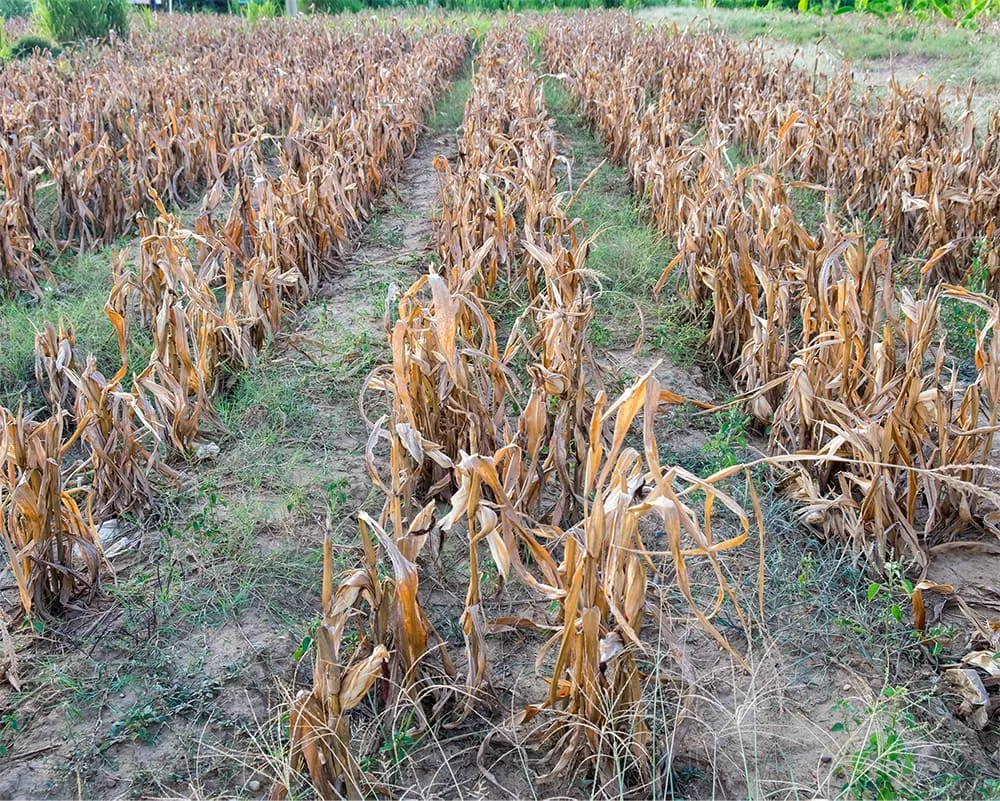
A single flood can submerge crops, wash away nutrient-rich topsoil, and leave behind debris or contaminants that make land unusable. Prolonged droughts dry out soil, lower yields, and force farmers to depend on costly, strained irrigation systems. In fact, The EU’s agriculture sector loses an average of €28.3 billion each year due to extreme weather intensified by climate change equating amount roughly 6% of the EU’s annual crop and livestock production, with only 20-30% of farmers’ climate linked.
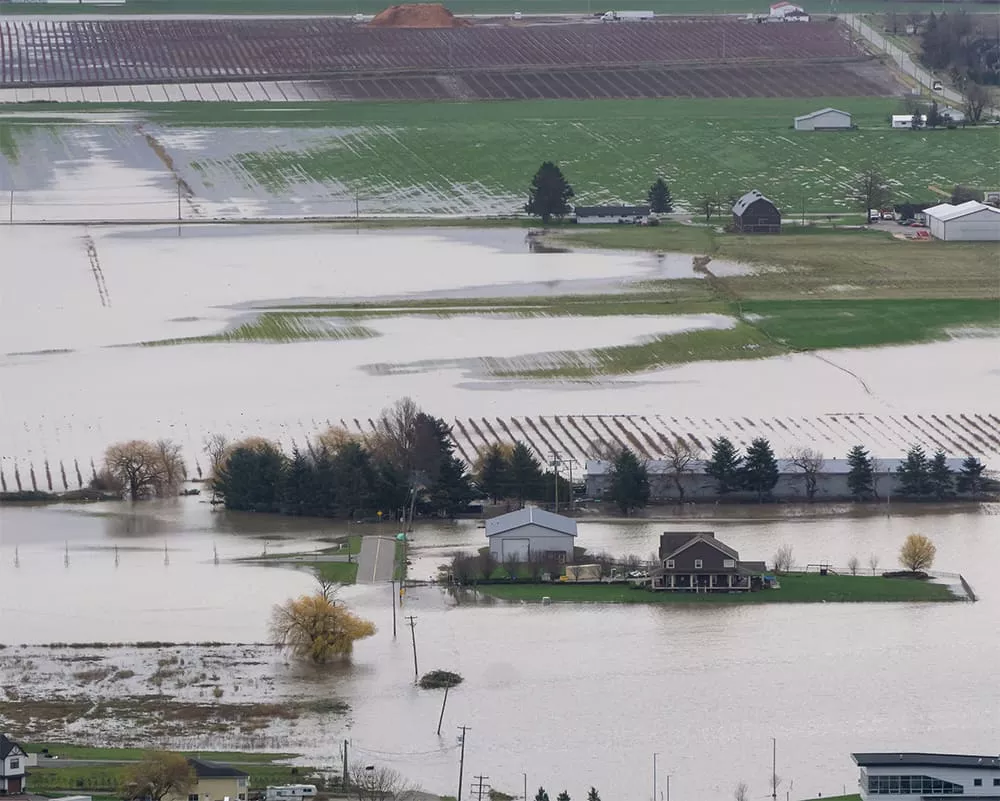
In agriculture, one of the most urgent needs after a disaster is determining the extent of crop loss. Farmers depend on this information to act quickly. Accurate assessments guide decisions on replanting, recovery efforts and insurance claims.
Introducing EO
Earth observation can play a crucial role in assessing crop damage after extreme weather events. Traditional methods of assessing crop damage rely on field inspections and manual reporting, which can be time-consuming, costly, and limited in coverage, especially after large-scale disasters
Using remote sensing data can quickly capture large-scale views of affected farmland, identifying areas impacted by floods, droughts, or storms. This allows for rapid, objective assessments without the delays and costs associated with extensive field inspections, with Copernicus playing a key role.
Copernicus enables tracking the likes of vegetation health, soil moisture, and surface water over time, providing objective, satellite-derived data to estimate the severity and extent of crop loss. By delivering timely and consistent information, Copernicus supports insurers of farmers in validating claims, streamlining loss assessments, strengthening underwriting decisions and future risk exposure models. For farmers themselves, this translates into faster claim resolutions and reduced disputes. More broadly, historical EO data can help farmers understand long-term patterns in their land and plan more effectively for climate variability.
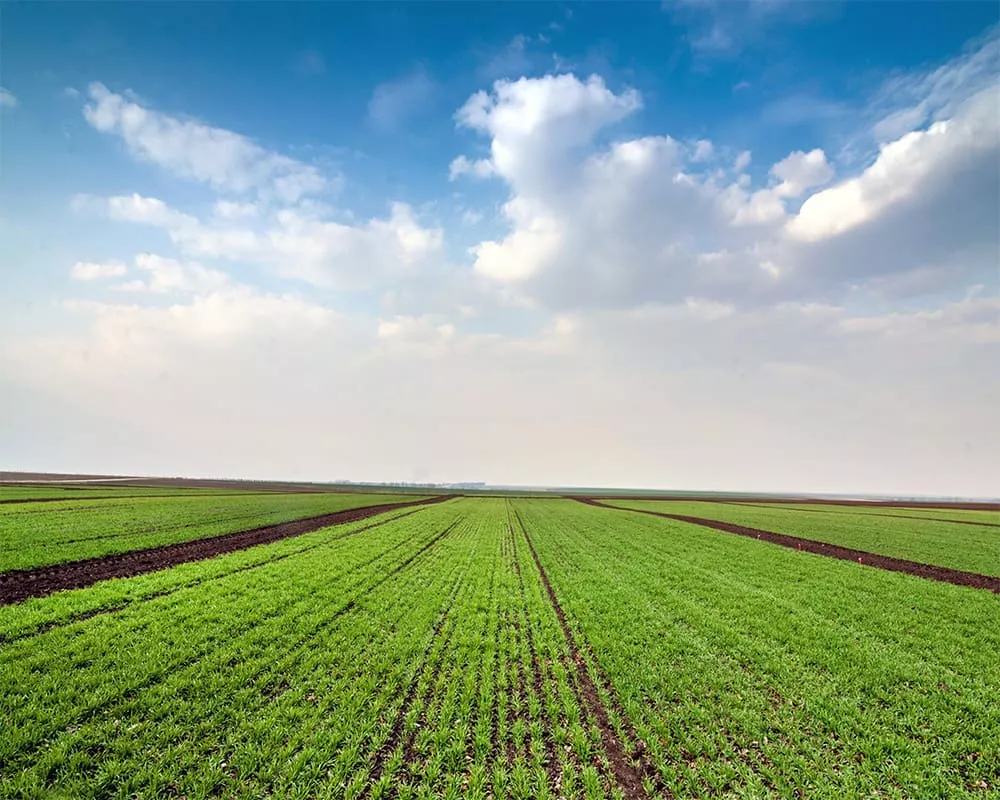
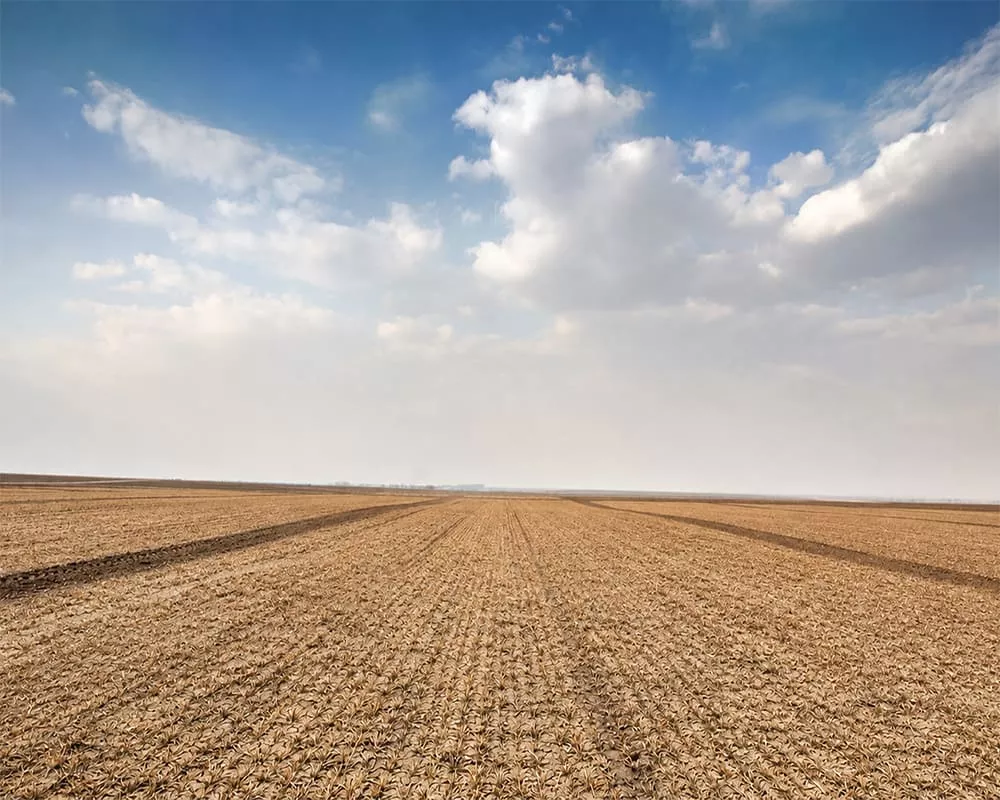
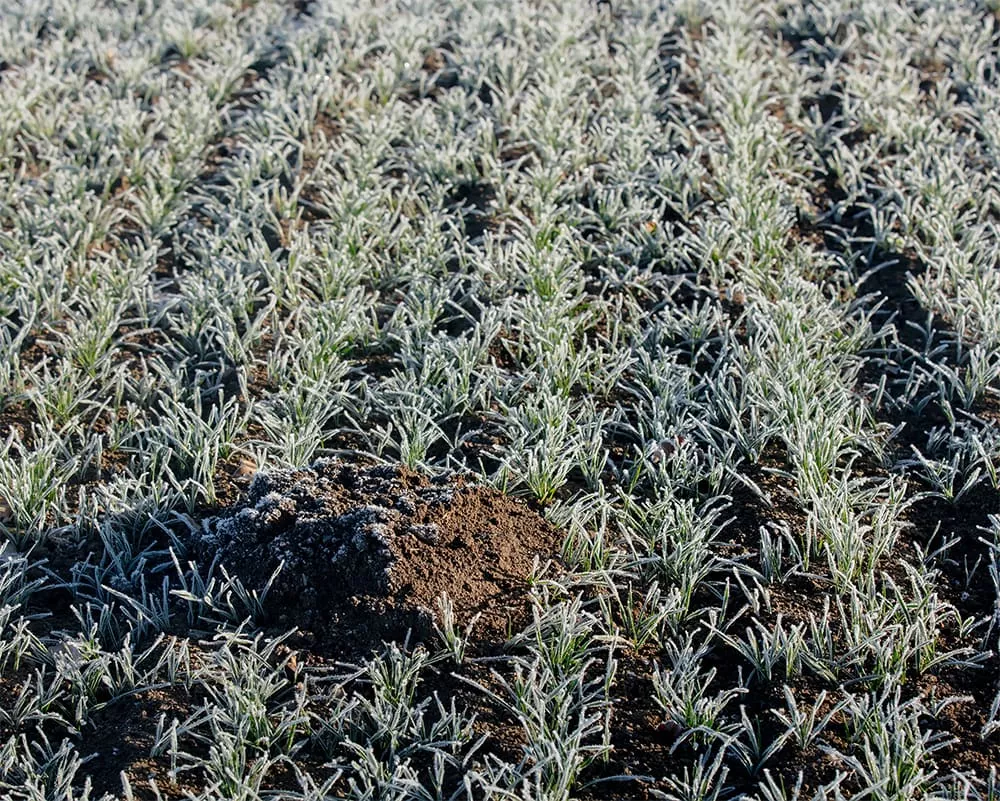
Extreme weather, such as highly elevated temperatures can devastate farmers' harvests by drying soil, scorching leaves, and killing plants before they ever produce fruit, effectively wiping out months of hard work and leaving fields bare.
Flood impact assessment
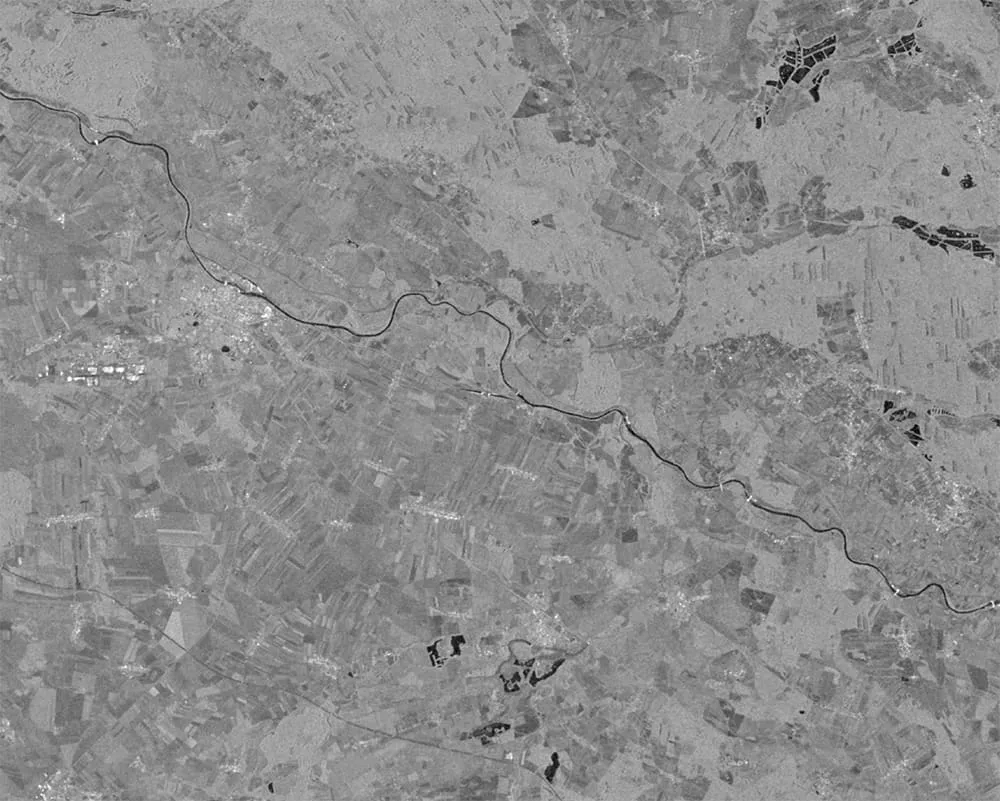
Sentinel-1 Synthetic Aperture Radar (SAR) data can penetrate cloud cover and operate day and night, an essential capability during and after flood events. Flooded areas can be detected using backscatter intensity thresholds, coherence change detection, and water extraction techniques such as the Normalized Difference Flood Index (NDFI). Radar data are particularly useful for mapping standing water extent and duration over cropland.
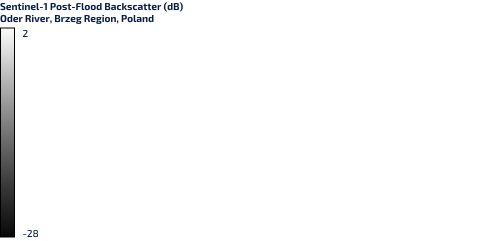
Here is a Sentinel-1 Synthetic Aperture Radar (SAR) image prior to a flooding event near the city of Brzeg, Poland. The Oder river can be seen running through the centre of the image. The legend displays the radar signal strength in decibels (dB), where darker tones (down to -28 dB) indicate smooth water surfaces and lighter grey tones (up to 2 dB) represent rougher terrain like buildings and vegetation. (Poland) September 2024 (source)
Sentinel-2 provides multispectral imagery that supports vegetation and water analysis through spectral indices. The Normalized Difference Vegetation Index (NDVI) and Enhanced Vegetation Index (EVI) can assess crop health and stress before and after flooding, while the Normalized Difference Water Index (NDWI) and Modified NDWI (MNDWI) help delineate surface water.
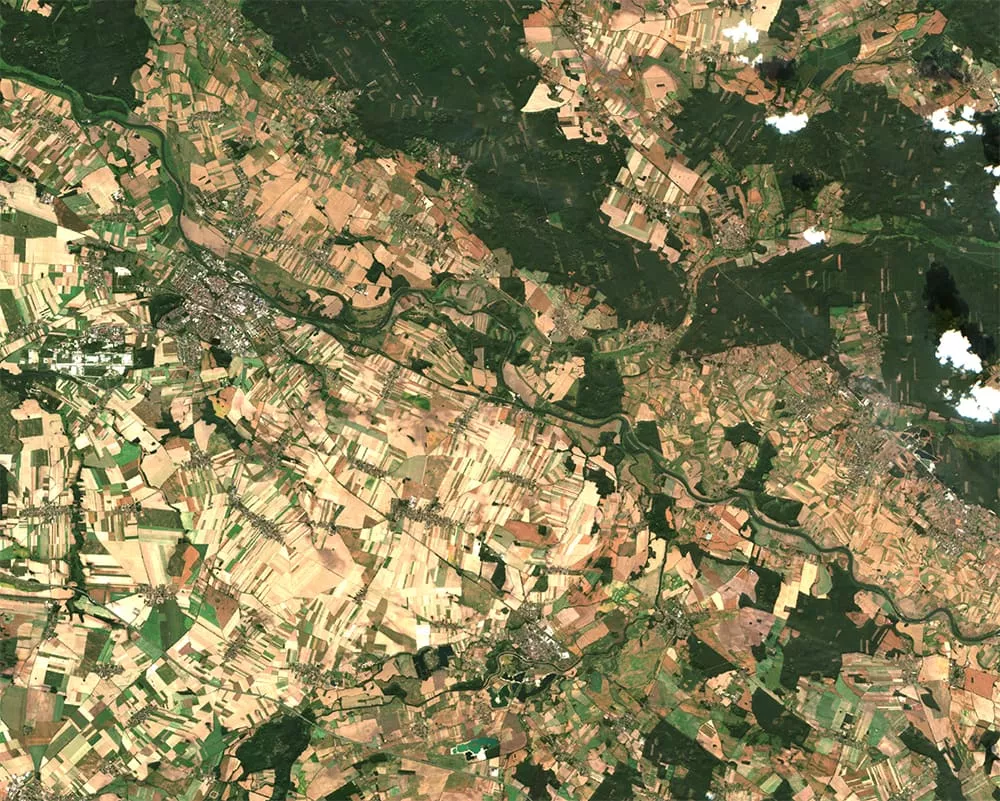
This shows the true colour Sentinel-2 image prior to the same flooding event. Agricultural lands can be seen on both banks of the river.
(Poland) September 2024 (source)
Together, this data provides objective evidence of flood extent and crop damage. This information can aid farmers in planning recovery actions and insurers to conduct accurate, data-driven loss assessments. Insurers rely on timely and reliable data, otherwise assessment and compensation can be delayed, increasing financial pressure on affected farmers. They can often also need wide geographic coverage if events happened across large regions.
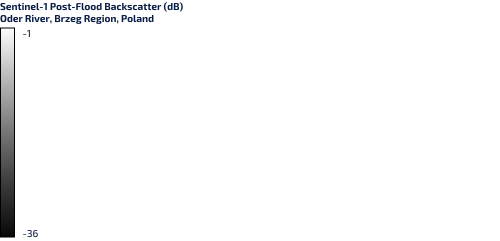
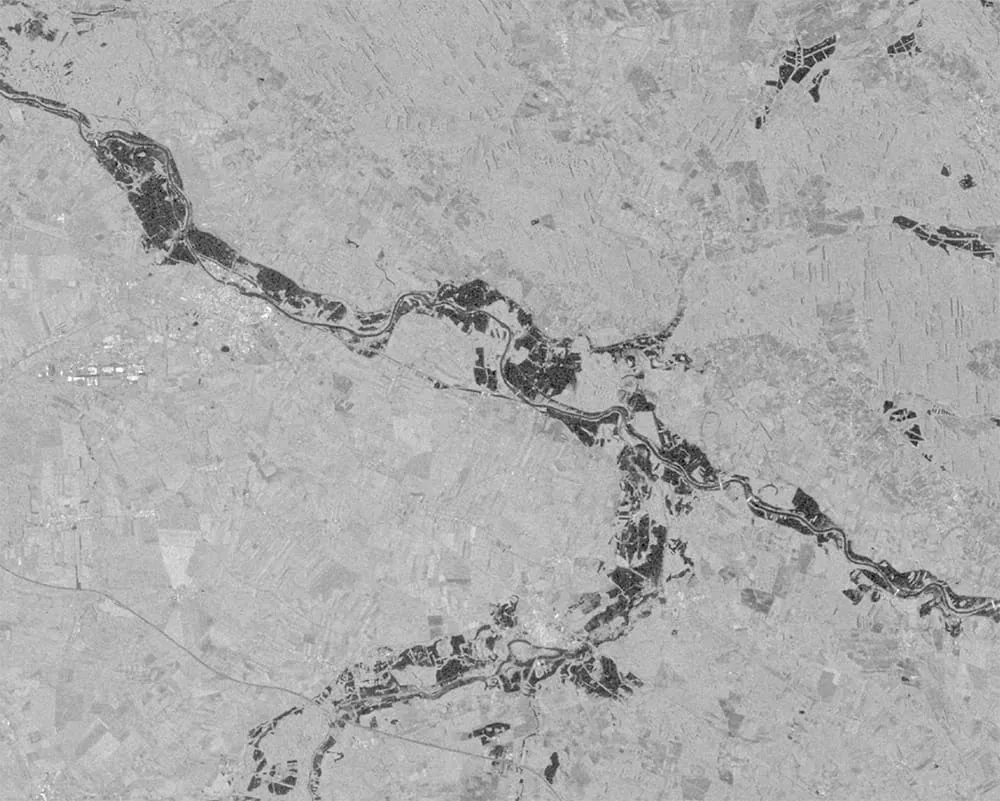
Here we see the post-flooding Sentinel-1 image. The dark patches on either side of the river are flooded agricultural fields. The legend displays the post-flood radar signal strength in decibels (dB), where the newly flooded fields appear as distinct dark zones with low backscatter values (down to -36 dB) compared to the non-flooded terrain (up to -1 dB). (Poland) - September 2024 (source)
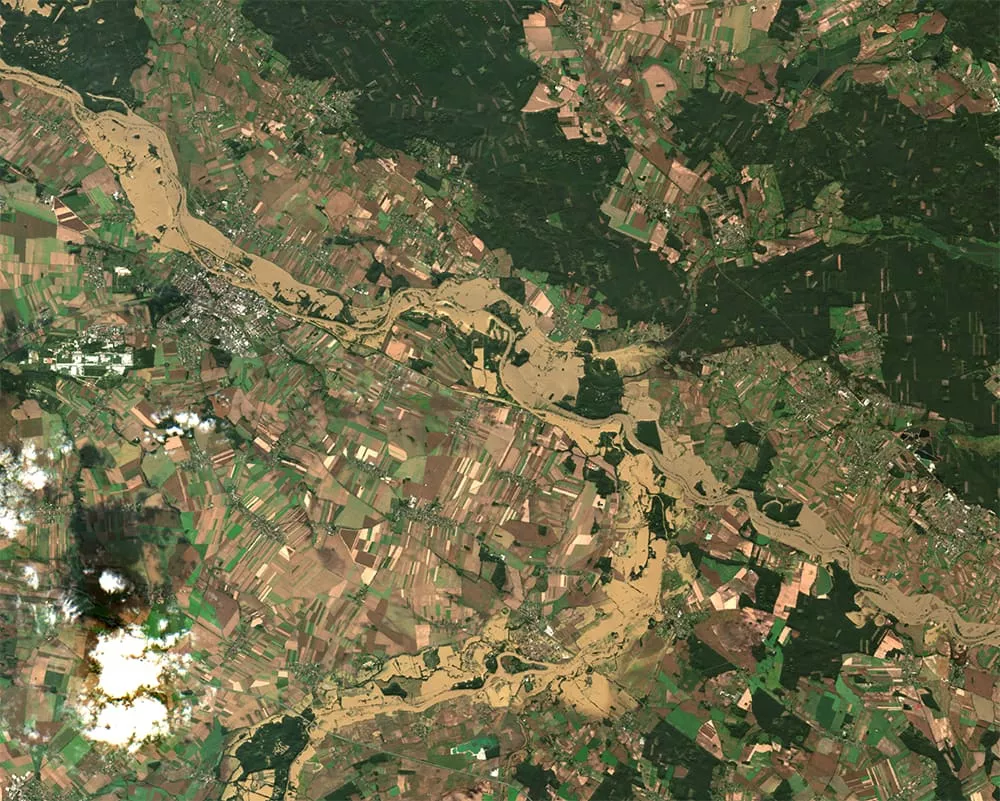
Here we can see the flooded fields via a Sentinel-2 true colour image. (Poland) September 2024 (source)
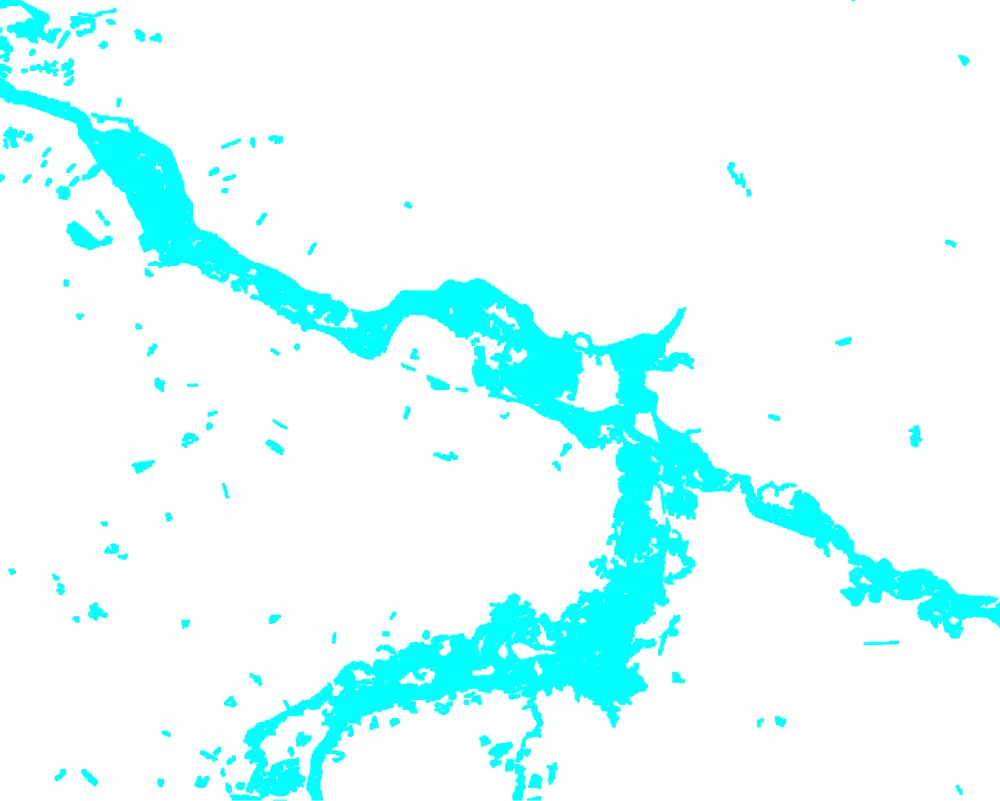
Here we see a flood mask derived from Sentinel-2. A flood mask is a geospatial raster layer that delineates flooded areas. (Poland) September 2024

Drought and extreme weather impact assessment
The Sentinel-2 mission plays a central role in assessing crop stress and damage as a result of drought or extreme weather events using multispectral imagery. Vegetation indices such as NDVI and EVI detect reductions in plant vigour, chlorophyll content and photosynthetic activity caused by the likes of drought, heat, hail, or wind damage. The Normalized Difference Red Edge (NDRE) index is also sensitive to chlorophyll content and early stress signals. Moreover, the Normalized Difference Moisture Index (NDMI) is used to monitor changes in water content of leaves. Time-series analysis of these indices allows detection of anomalies relative to historical averages, helping quantify the severity and timing of impacts on crop growth stages.
Sentinel-1 complements optical data using radar backscatter. This enables estimation of surface soil moisture during drought conditions and detection of saturated soils after storms. Coherence analysis between pre- and post-event images can reveal structural crop damage, such as lodging caused by strong winds. By integrating radar and optical datasets with ancillary variables like land-surface temperature or evapotranspiration, these approaches support comprehensive and objective assessments of weather-related crop losses.
Here we see a true colour Sentinel-2 image of farmland surrounding Emmeloord in The Netherlands. This image was taken in August 2021. Notice the patchwork of green fields with some fields more yellow and brown. (The Netherlands) - August 2021 - (source)
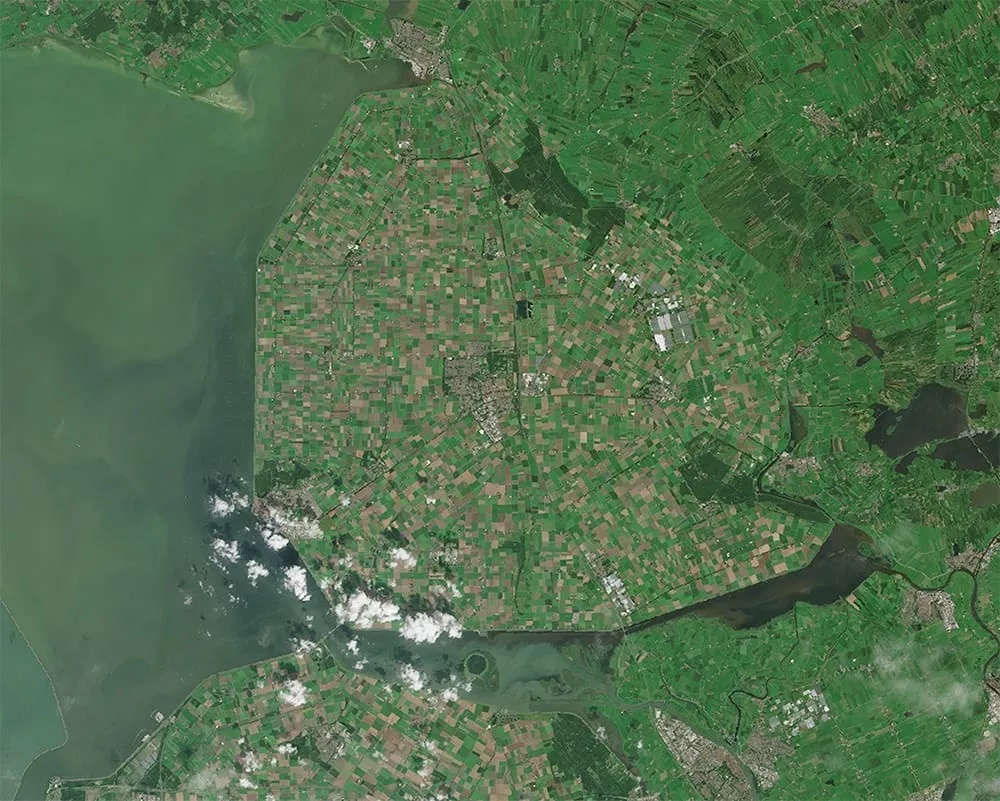
Here we see a true colour Sentinel-2 image of farmland surrounding Emmeloord, taken one year later, in August 2022. Notice how the fields are less green and much lighter yellow/brown. This is the result of a particularly hot and dry spell, causing drought in agricultural lands in the region.
(The Netherlands) - August 2022 (source)
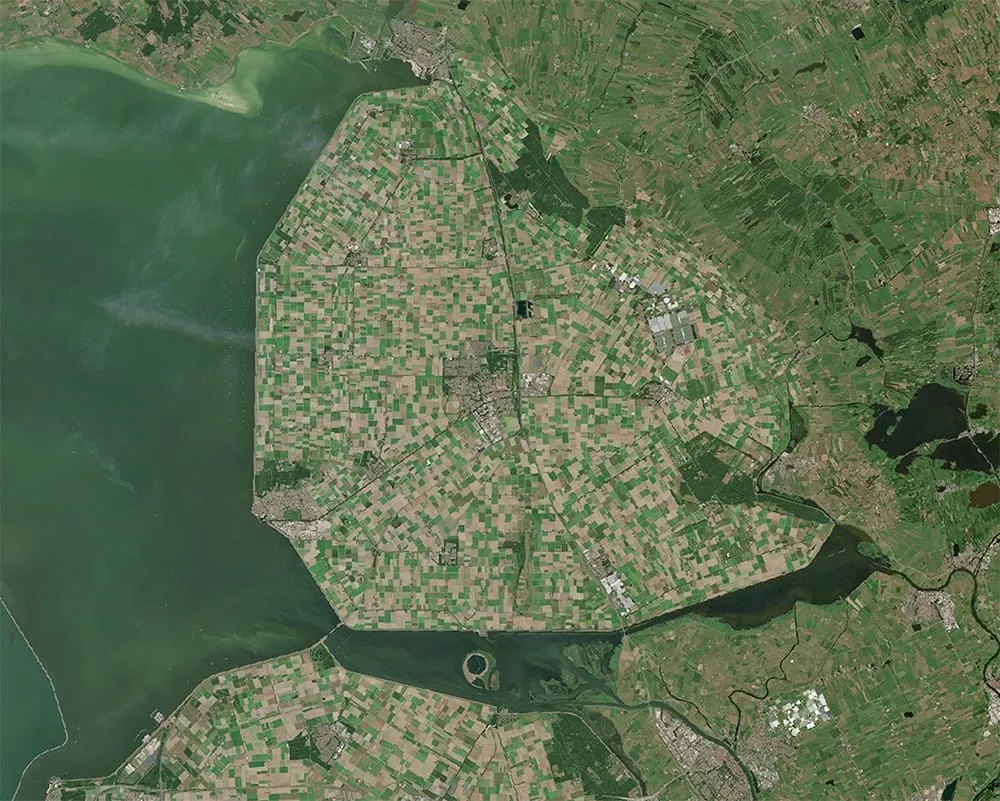
Here we see a true colour Sentinel-2 image of farmland surrounding Emmeloord in The Netherlands. This image was taken in August 2021. Notice the patchwork of green fields with some fields more yellow and brown. (The Netherlands) - August 2021 - (source)
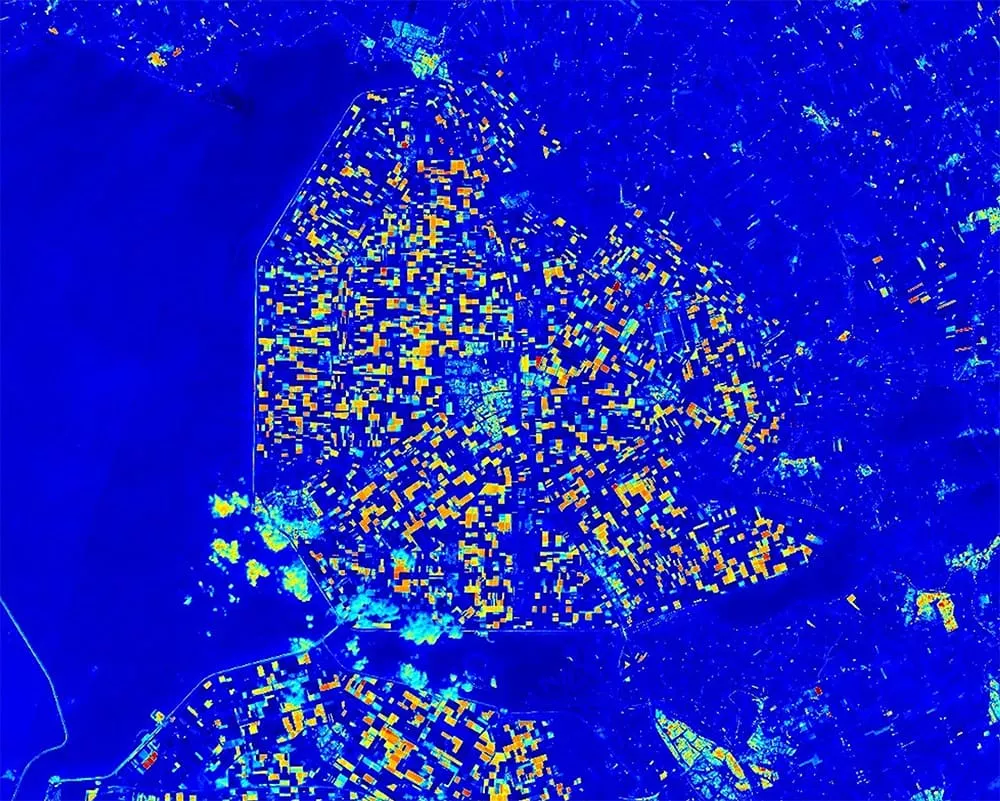
Here we see the Normalized Difference Moisture Index (NDMI) image derived from Sentinel-2 in August 2021. Notice most of the region is a deep blue colour. Darker, more intense blues signify greater moisture levels within vegetation in the region. Reds, oranges and yellows indicate low moisture or water stress within vegetation.
(The Netherlands) - August 2021 (source)
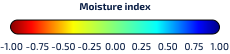
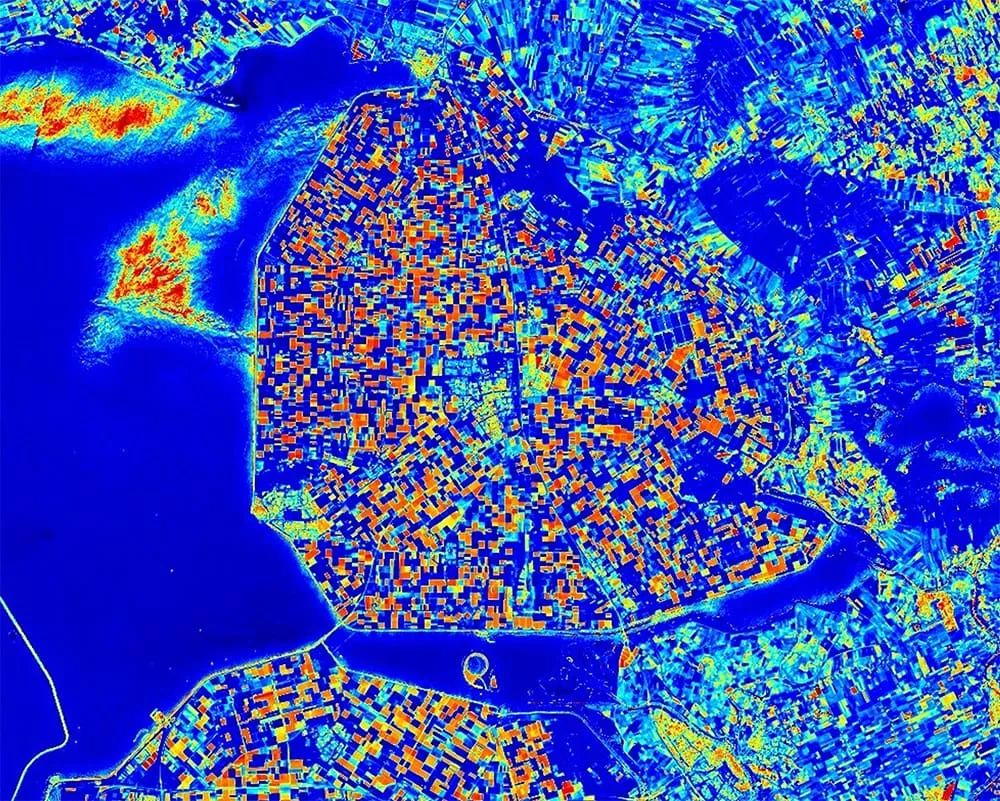
This is the NDMI image taken in August 2022. Notice the prevalence of yellows, oranges and reds. This indicates the effect of drought on vegetation in the region.
(The Netherlands) - August 2022 (source)
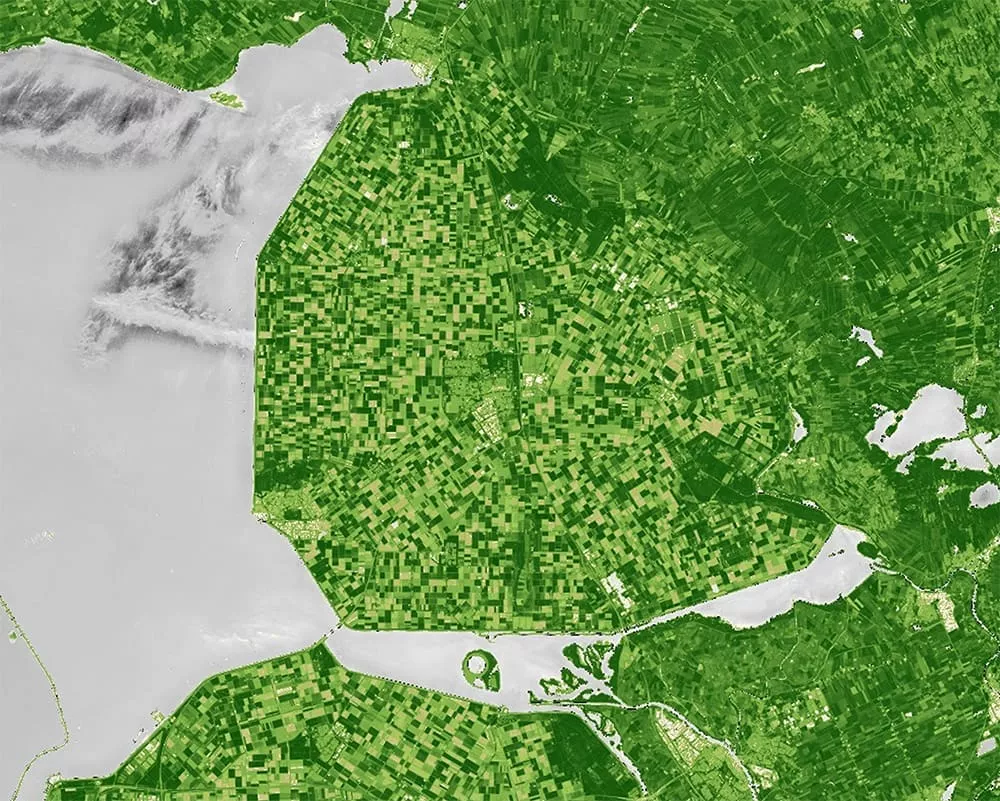
This shows the Normalized Difference Vegetation Index (NDVI) image taken in August 2021. Notice the prevalence of deep greens in the image, indicating healthy vegetation.
(The Netherlands) - August 2021 (source)
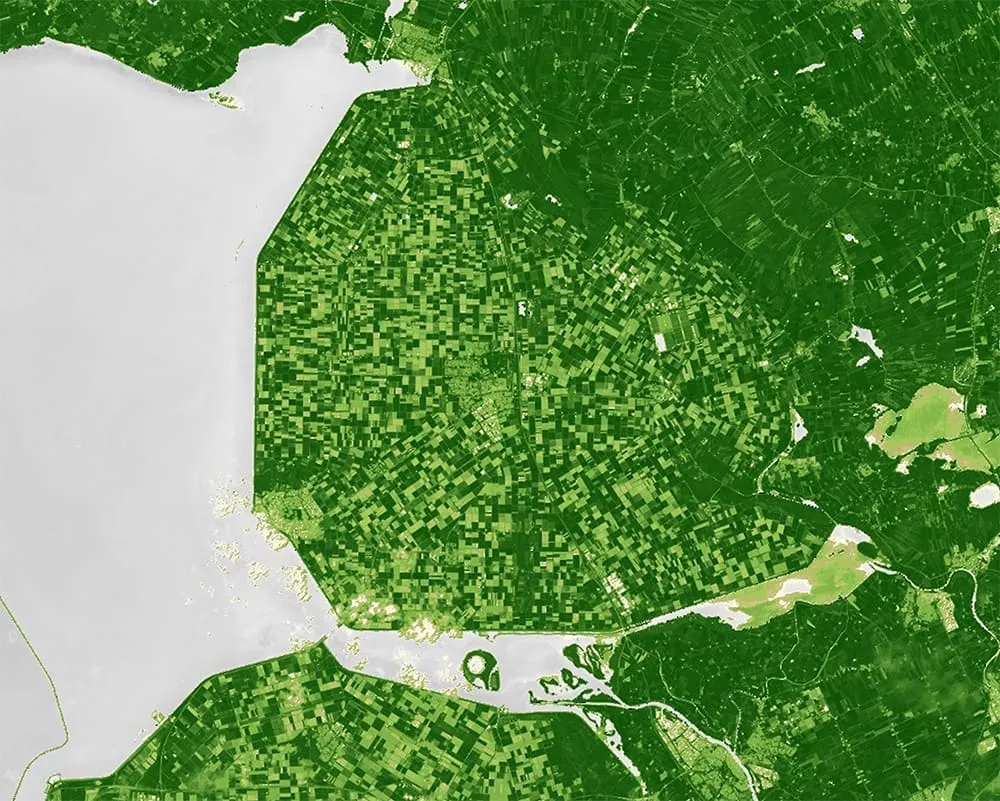
We now see the NDVI image taken in August 2022. The lighter greens and yellows indicate more stressed vegetation due to the effects of drought.
(The Netherlands) - August 2022 (source)
Copernicus Services
The Copernicus Programme supports monitoring of both drought and extreme weather impacts through several complementary services.
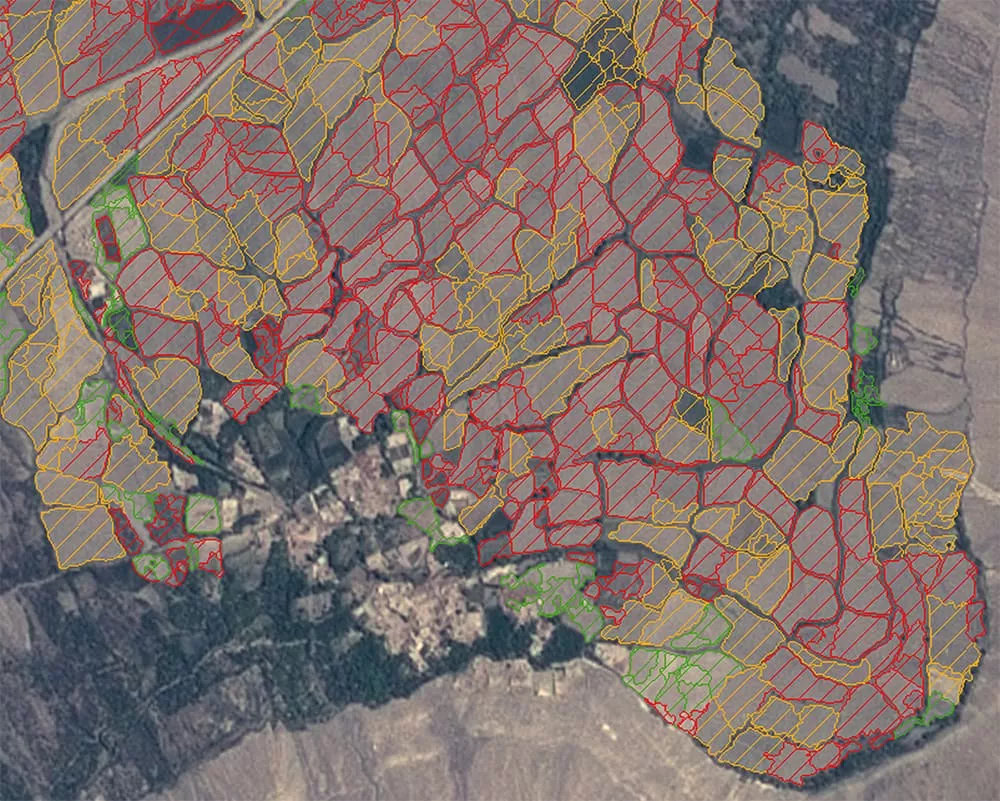
The Copernicus Emergency Management Service (CEMS) can deliver mapping products relating to extreme events such as floods, storms, or wildfires. Activations of CEMS can be requested by a defined set of authorised users, including EU member state authorities, international organisations, and humanitarian agencies. The images here show the Ishkashim region, a remote and mountainous area spanning the Afghanistan-Tajikistan border. The region is characterised by highly localised climatic conditions, where heavy rains were causing mudslides that threatened agricultural fields. In this case, the activation was requested in 2022 by Deutsche Welthungerhilfe e.V., a German humanitarian organisation, to support hazard identification and food security planning in the region to support local farmers and communities.
Here we see the Copernicus Risk and Recovery Mapping (RRM) service providing accurate mapping of individual fields. This CEMS activation created precise maps of agricultural parcels, allowing stakeholders to assess the area under cultivation and the types of crops being grown. (Ishkashim)
The Risk and Recovery Mapping (RRM) service is a component of CEMS that uses satellite and aerial imagery to provide on-demand geospatial information for disaster prevention, preparedness, risk reduction, and recovery. In this case the RRM service highlighted how extreme environmental factors influenced agricultural productivity, thereby providing a basis for targeted interventions. By mapping agricultural parcels and monitoring productivity trends, the service offered a comprehensive view of the vulnerabilities faced by local farmers. By delineating parcels and monitoring vegetation health, the activations supported efforts to strengthen community resilience in remote areas.
Moreover, the Copernicus Land Monitoring Service (CLMS) provides continuous observations of vegetation condition, land cover, and biophysical parameters such as leaf area index (LAI), Fraction of Absorbed Photosynthetically Active Radiation (FAPAR), and soil moisture proxies. For farmers, continuous vegetation and soil moisture data from CLMS helps monitor crop health throughout the growing season, enabling early detection of stress before it becomes severe loss. For insurers, objective land cover and biophysical data provides independent, verifiable evidence of vegetation condition to support accurate and consistent crop loss assessments.
Finally, the Copernicus Climate Change Service (C3S) provides long-term climate data records, seasonal forecasts, and reanalysis datasets that place extreme events in a historical context. For farmers, C3S seasonal forecasts can help anticipate adverse conditions ahead of a season, enabling earlier decisions on planting, irrigation, or protective action. For insurers, historical climate records and reanalysis datasets support more accurate risk pricing and provide an objective baseline to validate whether a claimed event was genuinely anomalous.
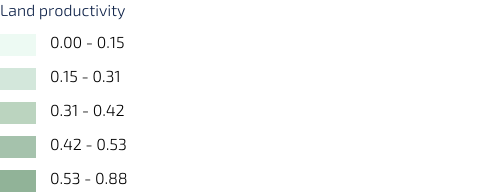
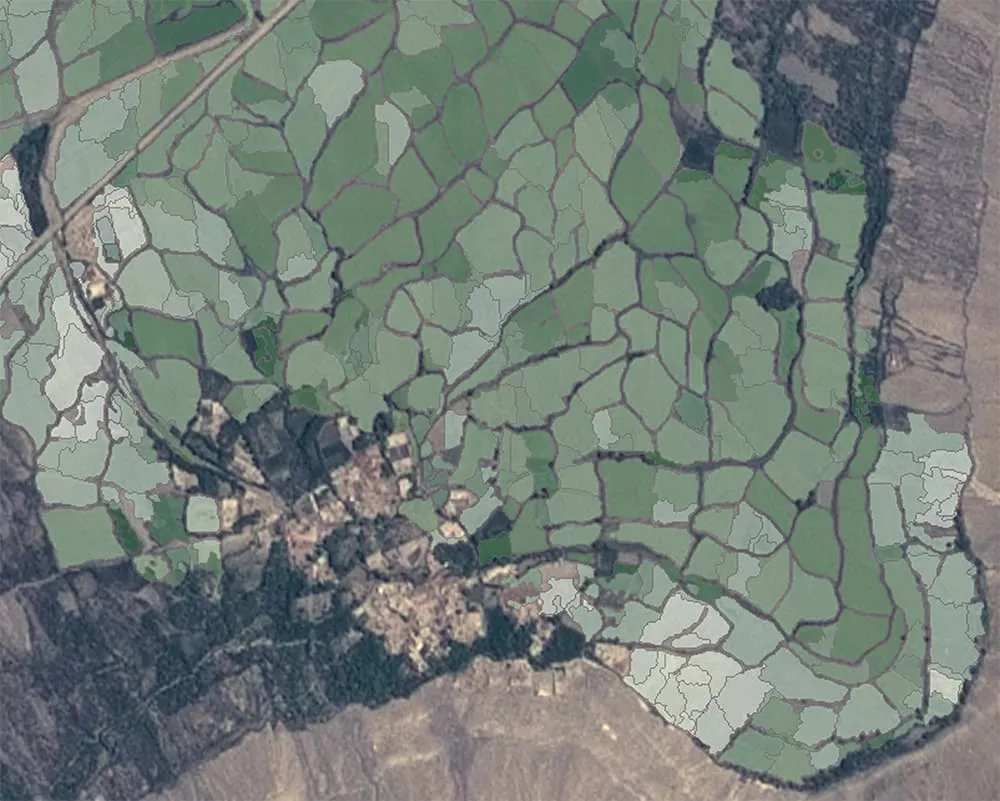
For the same area, the CEMS created maps of agricultural land productivity. This helped identify high- and low-productivity areas, offering a detailed understanding of regional agricultural dynamics which is vital for understanding food security. Land productivity is measured by tracking vegetation vigour across an entire growing season using NDVI. Productivity is calculated by summing NDVI values across 10-day intervals from crop emergence to harvest, then normalised to a standard scale for comparability. (Ishkashim)
Who benefits
from Copernicus?
By using Copernicus Programme services and Sentinel satellite data, crop conditions can be consistently monitored across large agricultural areas, particularly before, during, and after extreme weather events.
This multi-layered approach provides continuous, objective insight into crop health for farmers and identifies fields most severely affected, enabling prioritisation of field inspections, adjustment of management practices, and planning of recovery actions efficiently.
For insurers, Copernicus provides transparent and scalable evidence of hazard exposure and crop damage. After extreme events, satellite-derived indicators support rapid loss estimation, verification of claims, and risk modelling. This improves the speed and accuracy of compensation processes while strengthening long-term risk assessment and underwriting decisions.
Authorities concerned with food security, including relevant EU member state authorities, international organisations, and humanitarian agencies can request CEMS activations to obtain rapid, satellite-derived mapping products tailored to specific disaster events or risk assessments. This allows them to coordinate response efforts more effectively, validate conditions on the ground, and make evidence-based decisions in contexts where field access is limited or time-critical.
Satellite monitoring gives local communities faster, clearer answers after disasters, pinpointing the hardest-hit fields so recovery efforts can reach the right places first. By continuously tracking crop and land conditions, it protects not just individual farms but the broader rural landscape and the livelihoods that depend on it.
Explore this
further with us
Copernicus Sentinel data and many Copernicus service products are free and openly available, making it easier to scale monitoring across multiple sites and regions.
EUSPA can support stakeholders by helping identify fit-for-purpose Copernicus datasets, designing meaningful indicators, and connecting with EO service providers to operationalise dashboards, reporting and alerts.